-

TimeFilter simple
The indicator is an inter-week hourly filter.When executing trading operations, the indicator allows considering time features of each trading session.Permissiv...
-
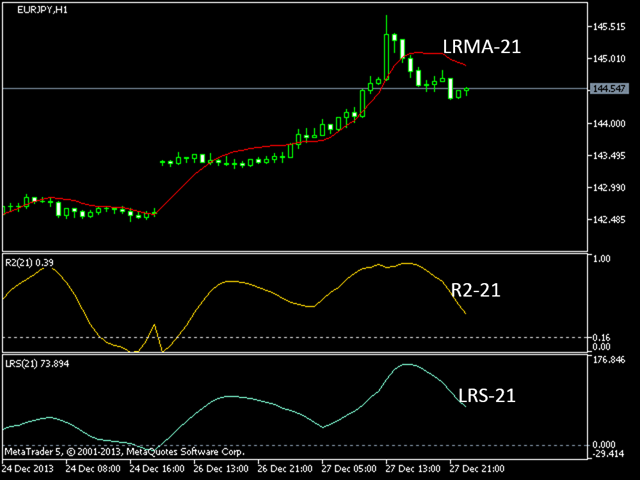
LRS Lineal Regresion Slope
If instead of giving the regression value indicator end of the regression line (LRMA), we give the value of its slope, we obtain LRS or Linear Regression S...
-
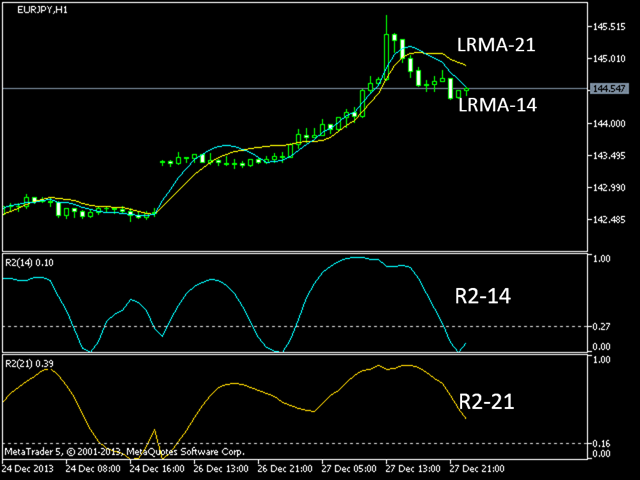
R2 oscilator
R2 (R-squared) represents the square of the correlation coefficient between current prices and deducted from the linear regression. It is the statistical m...
-
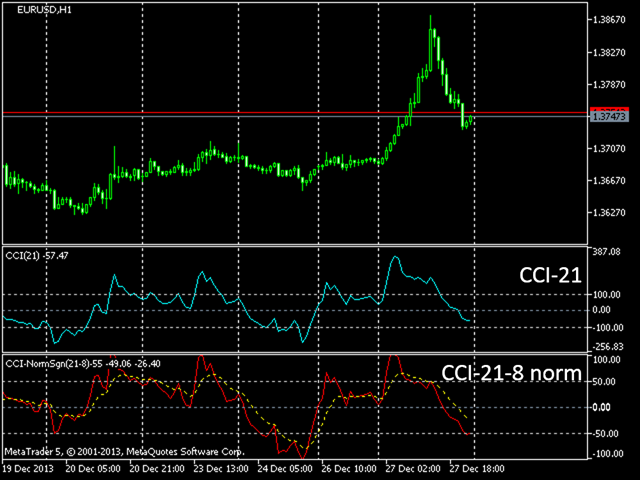
CCI normalized
Commodity Channel Index Technical Indicator (CCI) measures the deviation of the commodity price from its average statistical price. High values of the inde...
-
Bears Bulls Histogram
The Bears Bulls Histogram indicator is based on the standard Moving Average indicator.You have MA input parameters: maPeriod - Moving Average per...
-
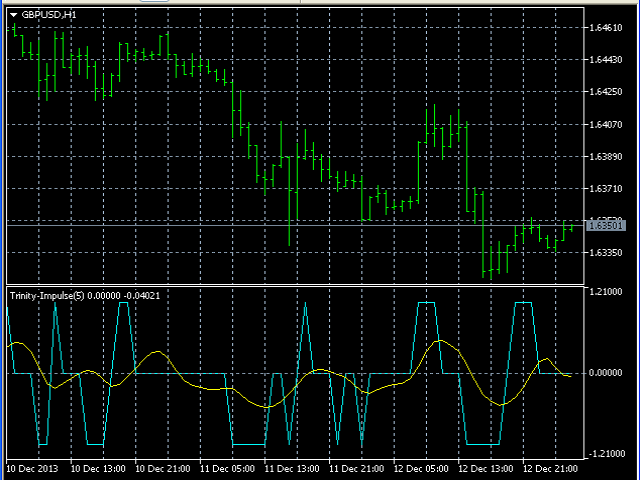
Trinity Impulse Relative Vigor Index
Trinity-Impulse indicator shows market entries and periods of flat.V-shaped impulse shows the time to enter the market in the opposite direction. Flat-topped im...
-

CCI Envelopes MT5
2 yellow lines represent the Envelopes with automatic deviation.The Envelopes indicator is a tool that attempts to identify the upper and lower bands of a...
-
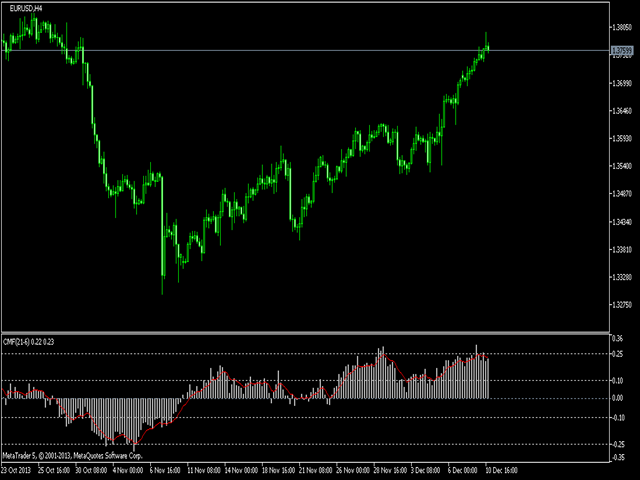
Chaikin Money Flow
This indicator incorporates the volume to inform the market trend. A warning system (chart, SMS and e-mail) is incorporated for warning when a certain level is...
-
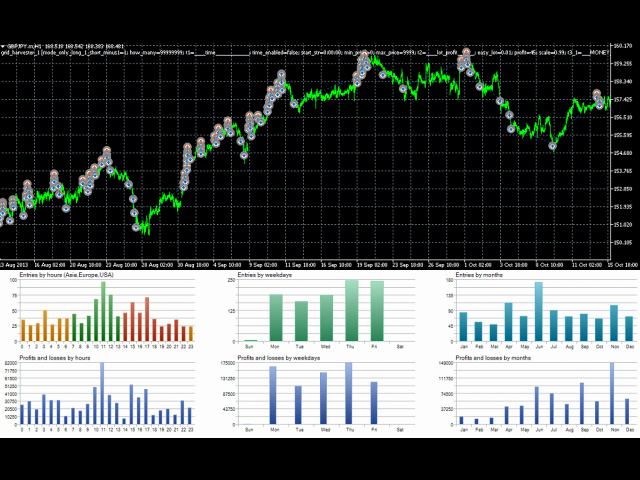
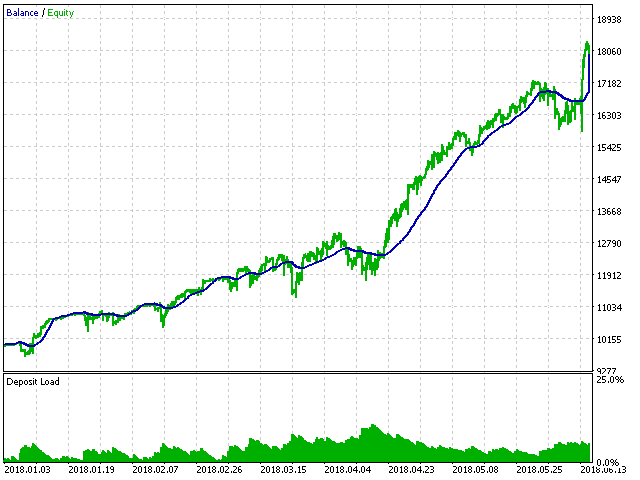
Grid Harvester MT5
WARNING: Product is out of support! Don't buy it unless you know how it works! Please download free version and test it heavily - it is enough for most uses...
-
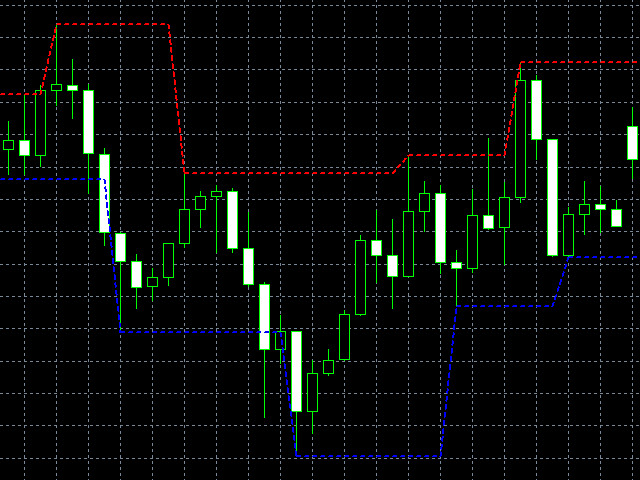
Support and Resistance
支撑和阻力指标是改编自标准的比尔威廉姆斯的分形指标。该指标可工作于任何时间帧。它在图表上显示支撑和阻力位,并允许设置止损和止盈级别 (您可以通过鼠标覆盖级别来检查其精确值)。蓝色点划线是支撑位。红色点划线是阻力位。如果您愿意, 您可以改变这些线的样式和颜色。如果价格接近支撑位,卖方的活跃度降低,买方的活跃度增加。如果价...

 网络资源
网络资源