-
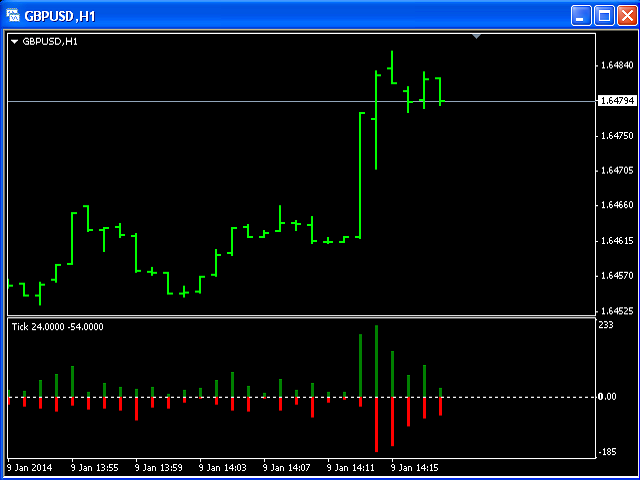
Tick Hour Tick MT5
This indicator is designed for H1 timeframe and shows:Sum of points when the price goes up (Green Histogram).Sum of points when the price goes down (Red Histogr...
-
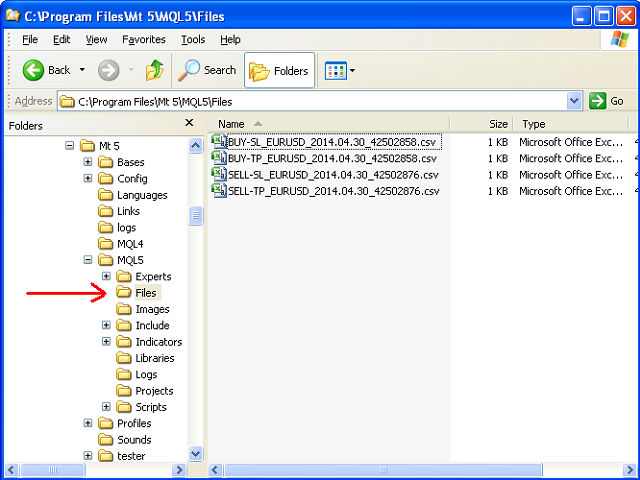
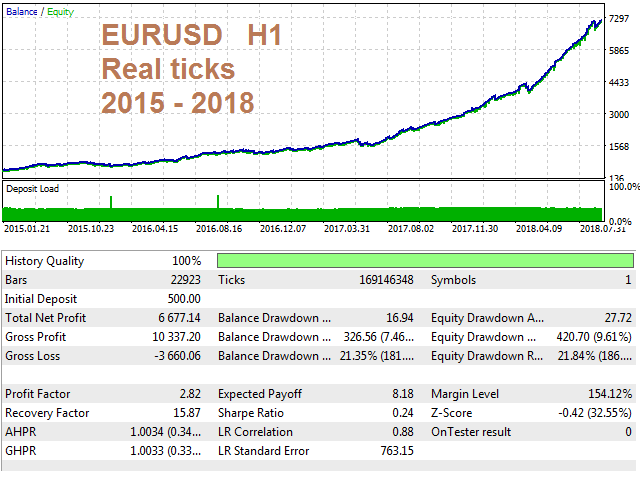
PositionGuard MT5
This indicator is intended to guard your open position at any time frame and currency pair. Long positionIn case the current price goes above the Take Prof...
-
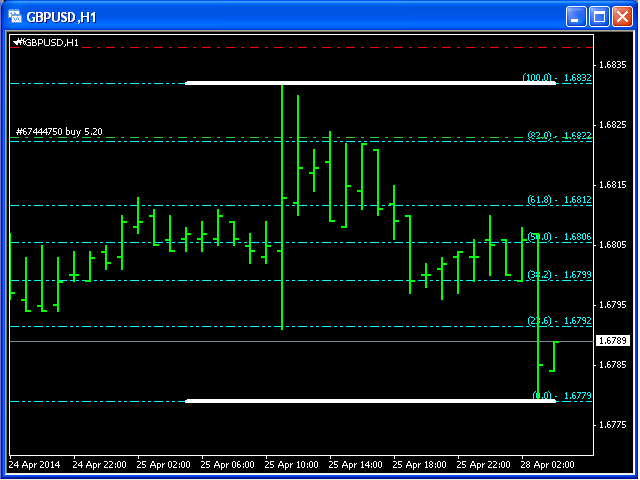
Support Resistance Fibonacci MT5
交易水平支撐和阻力的概念是技術分析中討論最多的屬性之一。 作為分析圖表模式的一部分,交易者使用這些術語來指代圖表上的價格水平,這些水平往往充當障礙,防止資產價格被推向某個方向。指标计算 nBars(n根柱线) 的距离,并绘制支撑和阻力线。技術分析師使用支撐位和阻力位來確定圖表上的價格點,其...
-
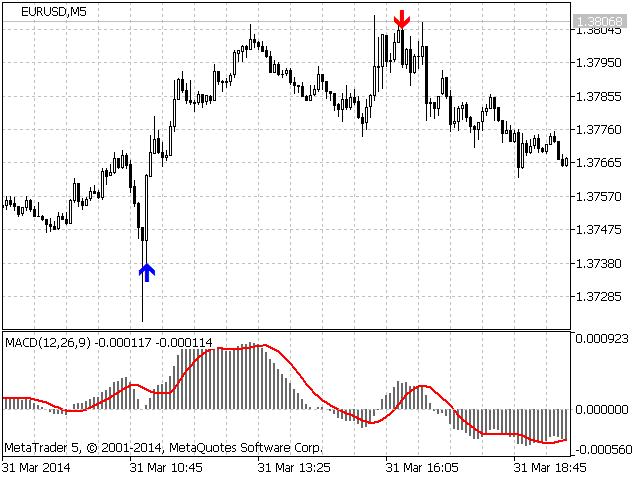
Divergence MACD
Divergence MACD indicator shows price and MACD indicator divergence. The indicator is not redrawn! The algorithm for detection of price and MACD extremums...
-
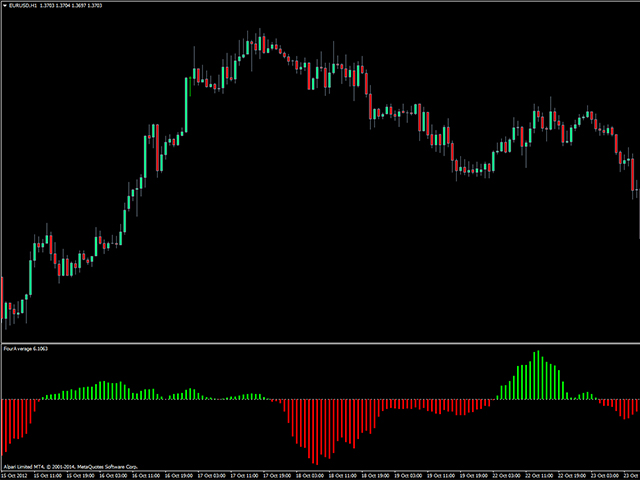
FourAverageMT5
FourAverage: A Breakthrough in Trend IdentificationWith evolving information technology and increasing number of market participants, financial markets get less...
-

Price River MT5
The indicator creates 2 dot lines representing an upper and lower bands and the main indicator aqua line as the price power.If the main line is swimming inside...
-
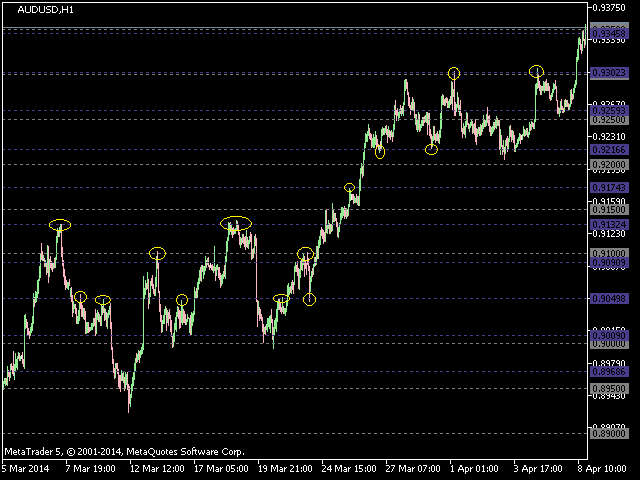
Levels on Chart
The indicator draws lines that can serve as support/resistance levels. They work both on Forex and FORTS. The main and additional levels are displayed as lines,...
-
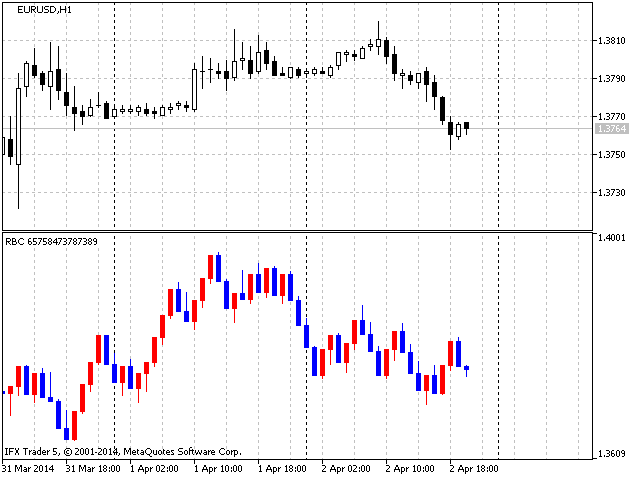
RBC Range Bar Chart
RBC 范围柱线图表 是一款经典范围柱线指标。本指标的功能是提供价格区间图表: 最高价/最低价区间是一个经典的用于分析的选项。它也有开盘价, 最高价, 最低价和收盘价。在第一个选项里, ;两个价格数值同时被分析, 而其它选项只使用一个。以往,范围柱线使用即时报价绘制,但由于即时报价数据未在服务器上提供,图表只...
-
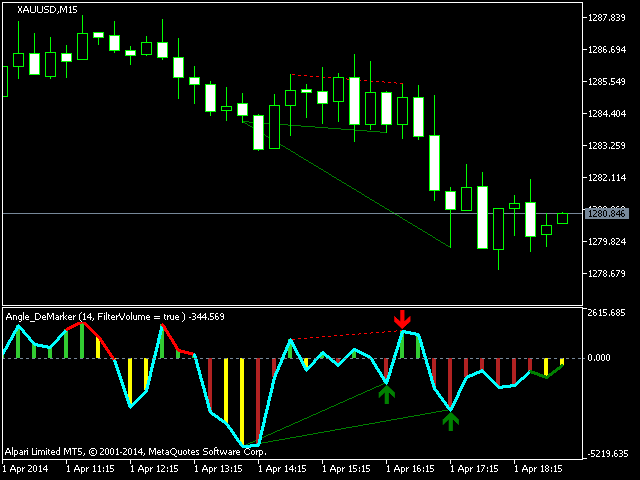
Angle DeMarker MT5
The indicator shows the angle of the DeMarker indicator line, which allows you to identify possible price extrema more accurately. Histogram bar color and size...
-
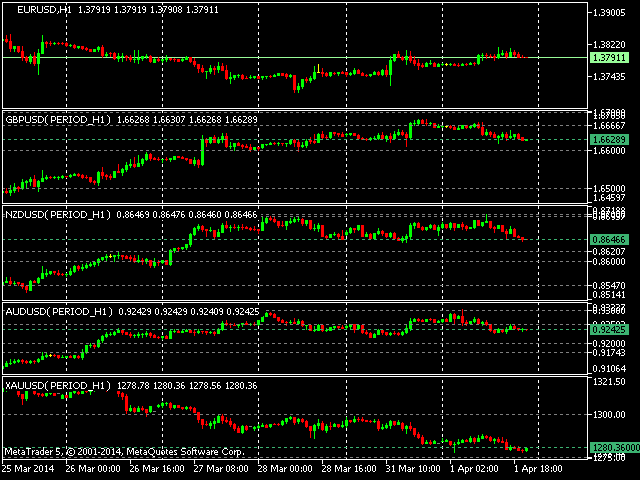
Pairs Trading Candle Chart
The indicator is designed for visual multicurrency analysis. It allows synchronous scrolling and analysis of a few charts simultaneously.The product can also be...

 网络资源
网络资源
 网络资源
网络资源