Bears Bulls Histogram
97
0
2024-01-05
The Bears Bulls Histogram indicator is based on the standard Moving Average indicator.You have MA input parameters: maPeriod - Moving Average period;maMODE - Moving Average mode (0 = MODE_SMA; 1 = MODE_EMA; 2 = MODE_SMMA; 3 = MODE_LWMA
The Bears Bulls Histogram indicator is based on the standard Moving Average indicator.
You have MA input parameters:
maPeriod - Moving Average period;
maMODE - Moving Average mode (0 = MODE_SMA; 1 = MODE_EMA; 2 = MODE_SMMA; 3 = MODE_LWMA);
maPRICE - Applied price (0=PRICE_CLOSE; 1=PRICE_OPEN; 2=PRICE_HIGH; 3=PRICE_LOW; 4=PRICE_MEDIAN; 5=PRICE_TYPICAL; 6=PRICE_WEIGHTED).
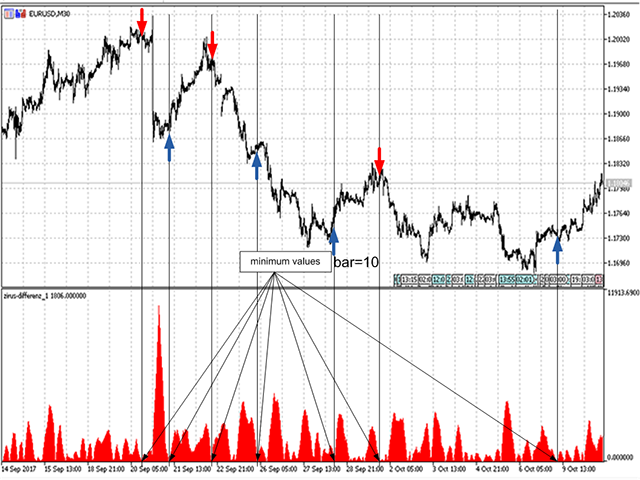
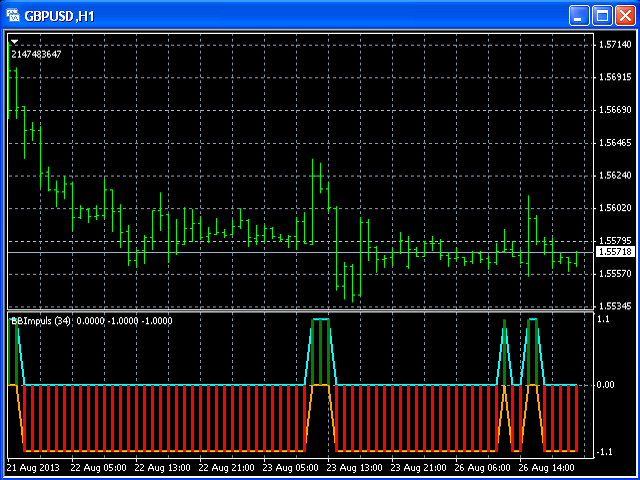
Green Histogram is representing an Up-trend and Red Histogram is representing a Down-trend.


 网络资源
网络资源