-

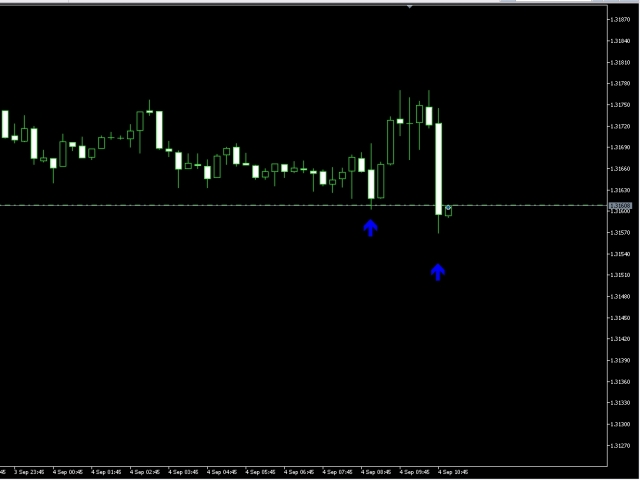
Line Crossing Alert
The Expert Advisor notifies that a price has crossed a line on the chart.It handles two types of lines - horizontal lines and a trendline. The number of lines i...
-
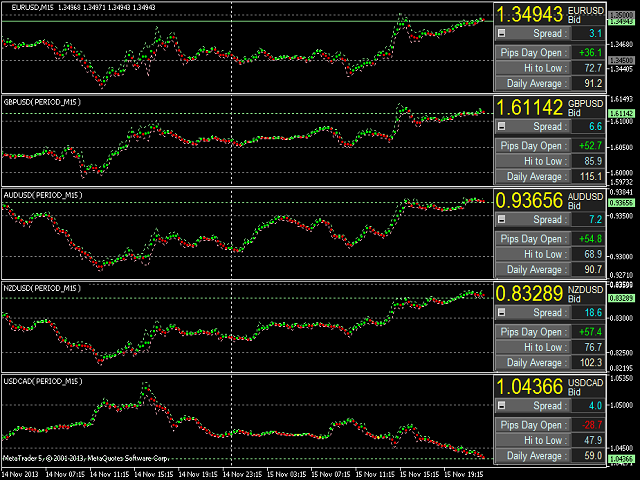
Pairs Trading Hedge Chart
This indicator is intended for visual multicurrency analysis. It allows synchronous scrolling and analysis of a few charts simultaneously and can also be used f...
-

Session Moving Average
The Forex trading market operates 24 hours a day but the best trading times are when the major trading sessions are in play.The Sessions Moving Average indicato...
-
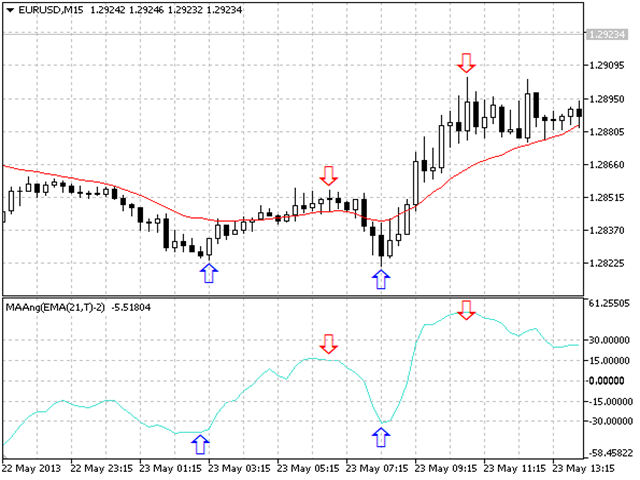
Moving Average Angle 13 types
"MA Angle 13 types" is an indicator that informs of the inclination angle of the moving average curve that is displayed on the screen.It allows s...
-
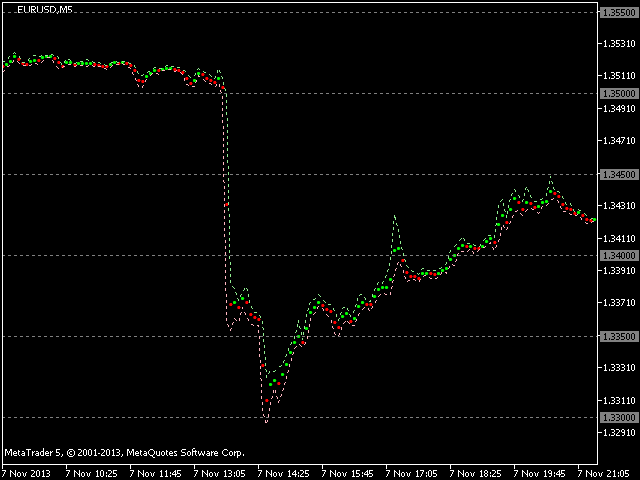
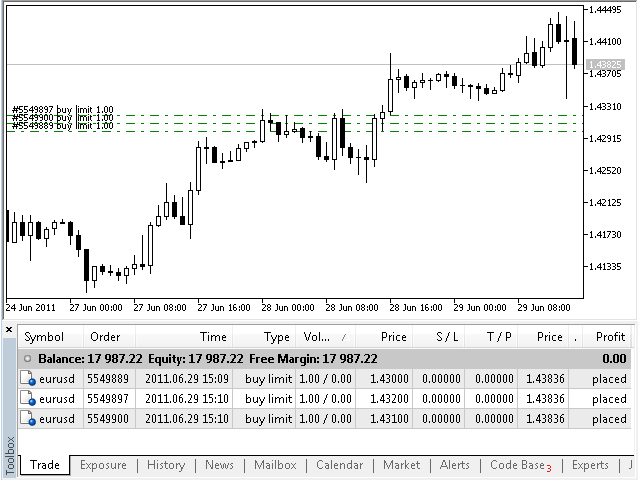
Custom Price Chart
The alternative representation of a price chart (a time series) on the screen.Strictly speaking, this is not an indicator but an alternative way of visual inter...
-
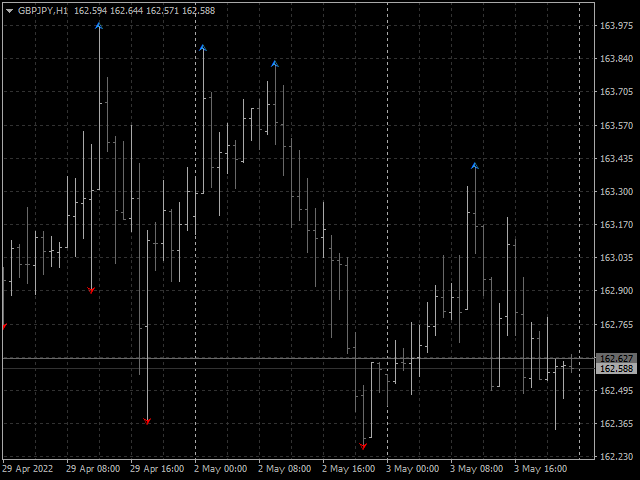
Synthetic Reverse Bar
Synthetic Reverse Bar is an evolution of Reverse Bar indicator.It is well-known that candlestick patterns work best at higher timeframes (H1, H4)...
-

Normalized ATR three modes
Is the market volatile today? More than yesterday? EURUSD is volatile? More than GBPUSD? We need an indicator that allows us to these responses and make compari...
-

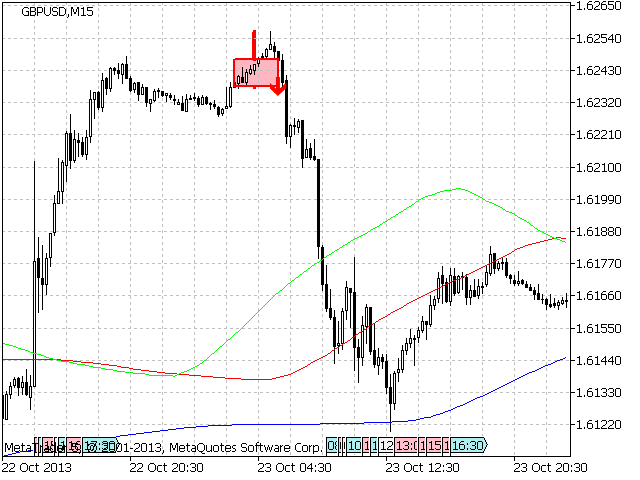
All MAs 13 types MULTIPURPOSE TOOL
"All MAs-13 jm" is a tool that allows accessing from a single control box 13 different types of MAs: 9 standard MAs in MetaTrader 5 (SMA, EMA, SMMA, L...
-
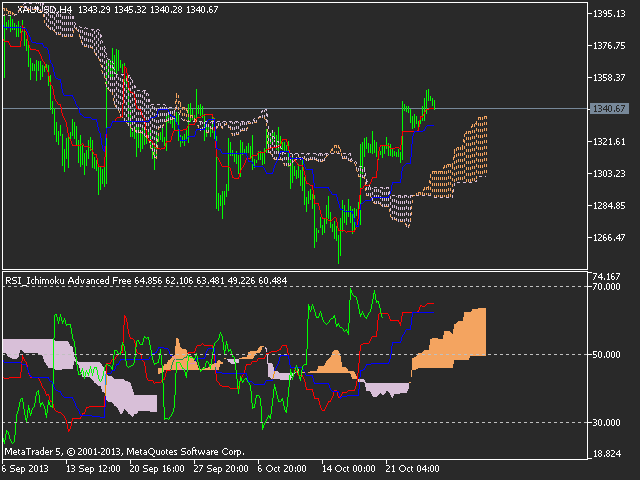
Ichimoku Advanced Free
Ichimoku Kinko Hyo 的目的-建立在几乎每一个交易市场被成功应用的趋势交易系统。它在许多方面都是独一无二的,但它的主要优势是其使用多个数据点,为交易者提供一个更深入,更全面的价格走势视角。这种深入视角,事实上,Ichimoku 是一款非常优秀的可视系统,能够令交易者从那些高概率中 "一目了然&...
-
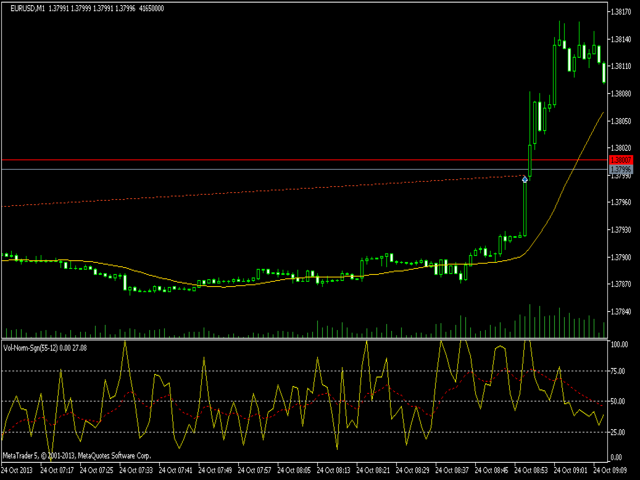
Normalized Volumes Indicator
When looking at the volume information that moves the market, a question arises: is it a strong or weak movement? Should it be compared with previous days? Thes...

 网络资源
网络资源