-
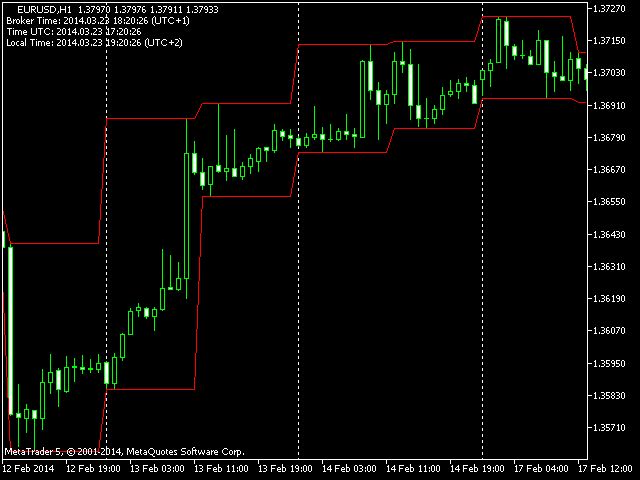
High And Low MT5
On the current chart, this indicator displays candlestick highs and lows of another time frame.Input Parameters:TimeFrame - chart time frame whose data wil...
-
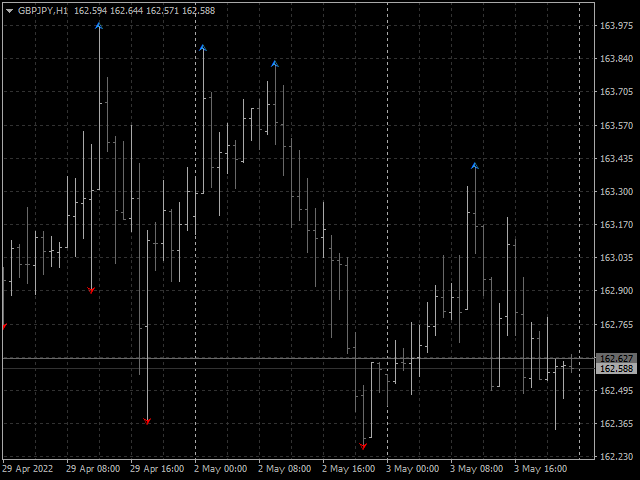
Extended Fractals MT5
该指标扩展了标准分形的功能,允许您查找、显示和使用它们,计算任何奇数长度,即 3、5、7、9 等柱线。分形不仅可以通过柱线价格来计算,还可以通过给定时期的移动平均线的值来计算。所有类型的警报都在指标中分别针对上分形和下分形实施。设置使用条的数量,在settings中设置Left fractal bars count变量...
-
Fibonacci Waves MT5
The Fibonacci series. This number sequence is formed as each subsequent number is a sum of the previous two.it turns out that it refers to its neighbors in...
-
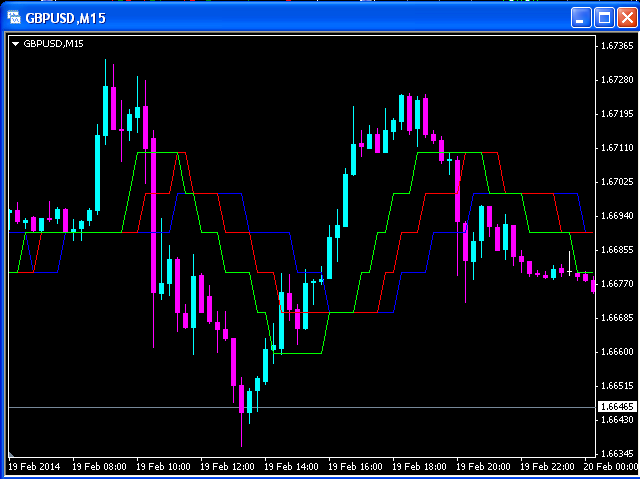
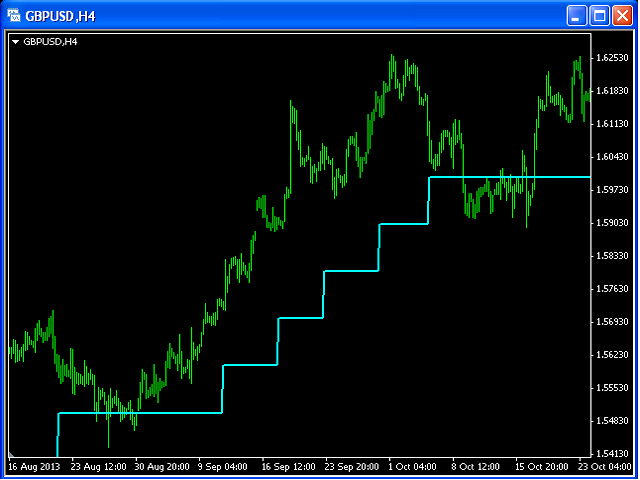
Alligator Steps MT5
This indicator is based on the classical Alligator indicator which is a trend trading indicator.Stay in the trade as long as the candlesticks ride above or belo...
-
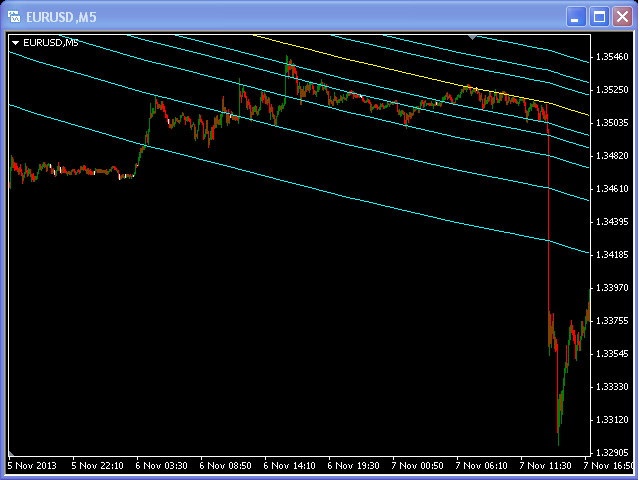
Four Bands
Optimistic trader may enter the market when the price crosses the Aqua line.More reliable entry will be when the price crosses the Blue line.When the price come...
-
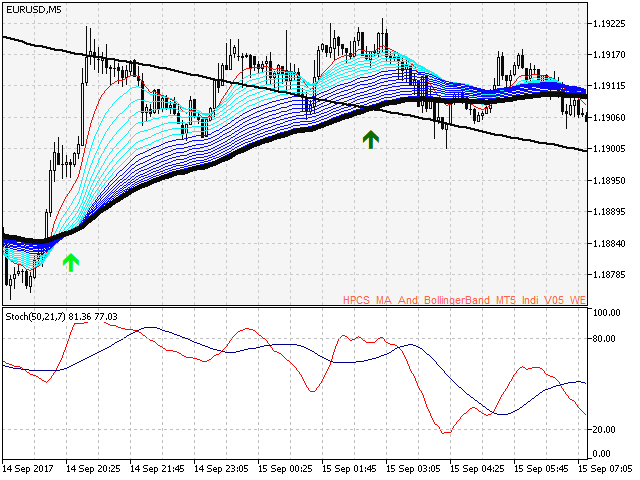
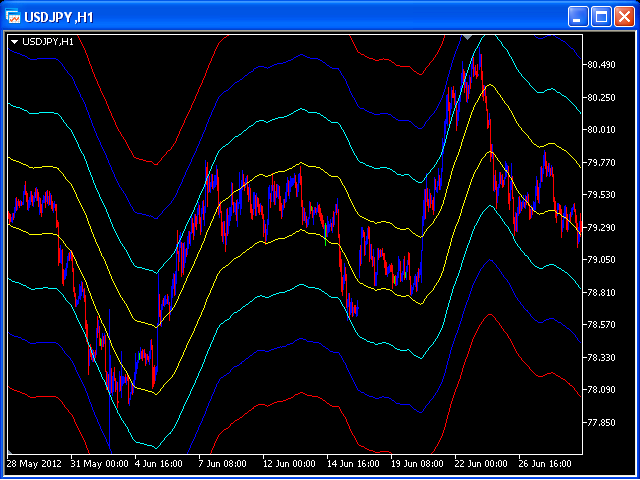
Moving Above Average MT5
A moving average is commonly used with time series data to smooth out short-term fluctuations and determine longer-term trends. The proposed indicator has...
-

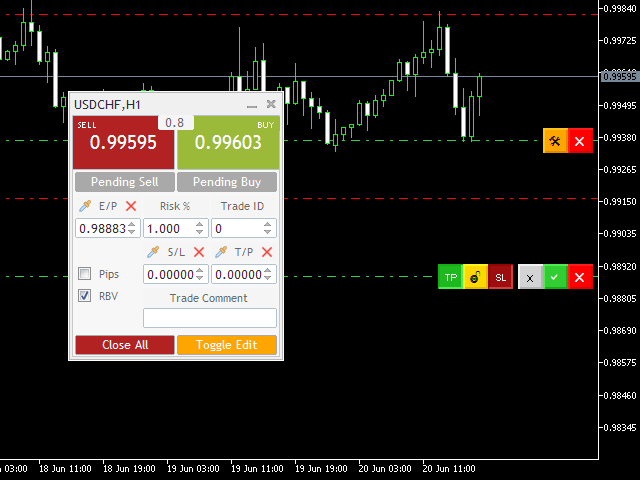
Trading Sessions Pro
Trading Sessions Pro is a trading session indicator with extended settings + the ability to install and display the custom period.Main Advantages:The indic...
-

-

RS Levels MT5
該指標旨在建立水平支撐和阻力水平。水平搜索算法基於對極值的分組。可以顯示每個級別的統計信息,通過多個屬性過濾級別的顯示,根據級別的類型(支撐或阻力)調整配色方案。特點:指示器已準備好工作,在大多數情況下不需要特殊設置手動或自動選擇極值範圍以構建關卡選擇要顯示的最近級別數以防止圖形混亂靈活的圖形設置(顏色、線條和箭頭樣式...
-
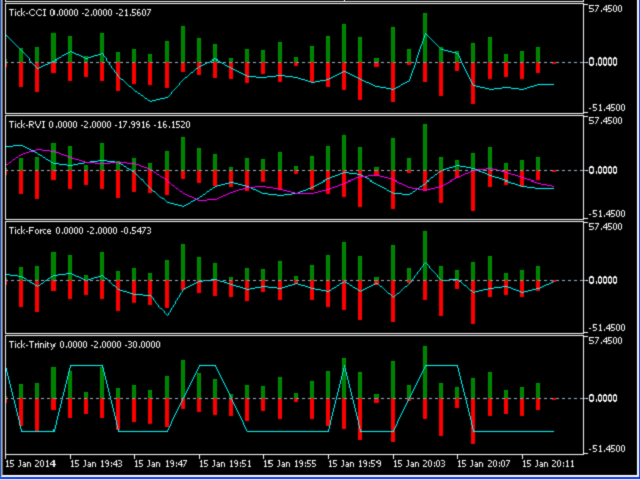
Tick by Tick plus Indicator by choice
This indicator is designed for M1 time frame and shows:Sum of points when the price goes up (Green Histogram).Sum of points when the price goes down (Red Histog...

 网络资源
网络资源