R2 oscilator
R2 (R-squared) represents the square of the correlation coefficient between current prices and deducted from the linear regression. It is the statistical measure of how well the regression line is adjusted to the actual data, and therefore
R2 (R-squared) represents the square of the correlation coefficient between current prices and deducted from the linear regression. It is the statistical measure of how well the regression line is adjusted to the actual data, and therefore it measures the strength of the prevailing trend without distinguishing between ascending and descending one.
The R2 value varies between 0 and 1, therefore it is an oscillator of bands that can show signs of saturation (overbought / oversold). The more the value approaches zero, the weaker the trend and, conversely, the closer you approach to 1, the stronger the trend.
For example, an R2 of 0.7 calculated over a period of 5 days means that 70% of the price movements in that interval are explained by the regression line and the remaining 30% is unexplained noise.
Calculation
p= price; t= period
The confidence of the predictions of strength of R2 depends on the period of its calculation. Statistically their critical values for the 95% confidence are:
       period   R2 value (95% confidence)
         5        0.77          10       0.40          14       0.27          20       0.20          25       0.16          30       0.13          50       0.08          60       0.06          120      0.03
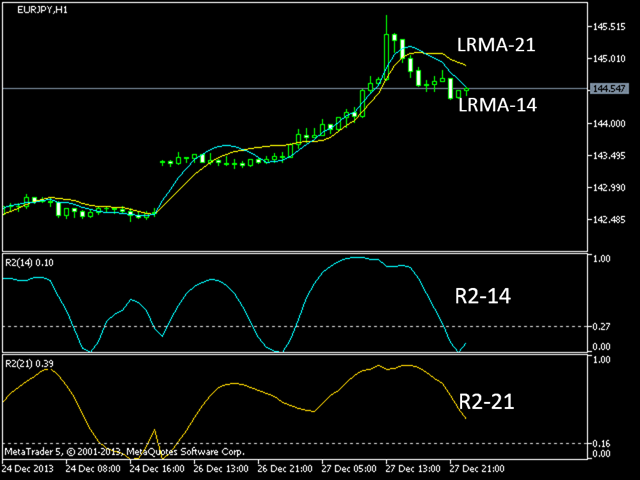
The usefulness of this indicator increases when used with the linear regression slope indicator that reports the direction of the trend, while R2 informs us of the strength of the trend.


 网络资源
网络资源