Levels on Chart
The indicator draws lines that can serve as support/resistance levels. They work both on Forex and FORTS. The main and additional levels are displayed as lines, with the color and style defined by the user. Additional levels are only displayed for cu
The indicator draws lines that can serve as support/resistance levels. They work both on Forex and FORTS. The main and additional levels are displayed as lines, with the color and style defined by the user. Additional levels are only displayed for currency pairs without JPY.
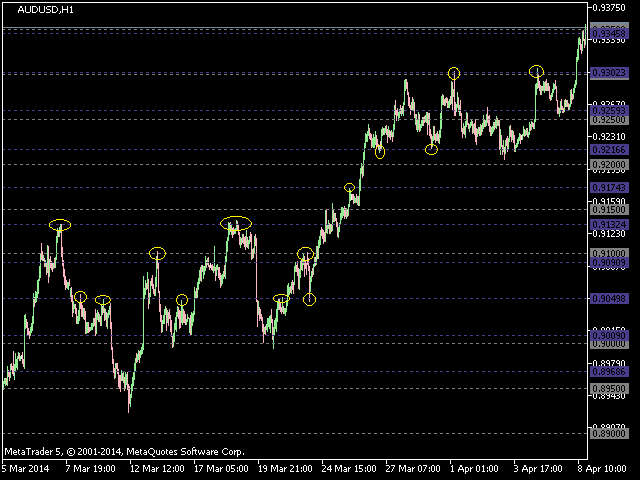
Please see the AUDUSD chart below. Yellow ovals indicate some characteristic points where price reaches one of the levels.
The second screenshot shows a FORTS instrument chart with the characteristic points.
Simply watch the indicator work on history and in real time mode.
External parameters:
Levels Step Size, points - step between adjacent levels in points - it is usually set as multiple of 500 (or 400 for currency pairs with JPY).
Up & Down Levels Number - number of price levels displayed above and below the current price. If set to 4, the indicator displays the level closest to the price (4 below and 4 above).
Levels Line Color - color of the main levels.
Levels Line Style - style of the main levels.
Adding Levels Line Color - color of the additional levels.
Adding Levels Line Style - style of the additional levels.
If you have an interesting idea for improvement of this or any of my other products, then in case of implementation, the author of the idea will get a generous discount on any of my products.
Please share your suggestions in the product's Comments section to allow for documenting and determining the original author of any given idea.


 网络资源
网络资源