Pairs Trading Candle Chart
The indicator is designed for visual multicurrency analysis. It allows synchronous scrolling and analysis of a few charts simultaneously.The product can also be used for pairs trading. The indicator works both on Forex and Russian FORT
The indicator is designed for visual multicurrency analysis. It allows synchronous scrolling and analysis of a few charts simultaneously.
The product can also be used for pairs trading. The indicator works both on Forex and Russian FORTS market. The product has a very important property - if there are skipped bars at the symbols, the synchronism of charts on the time axis is fully preserved.
Each chart point is strictly synchronous with the others on the time axis at any time frame. This is especially true in the stock market, as well as for low-liquidity symbols.
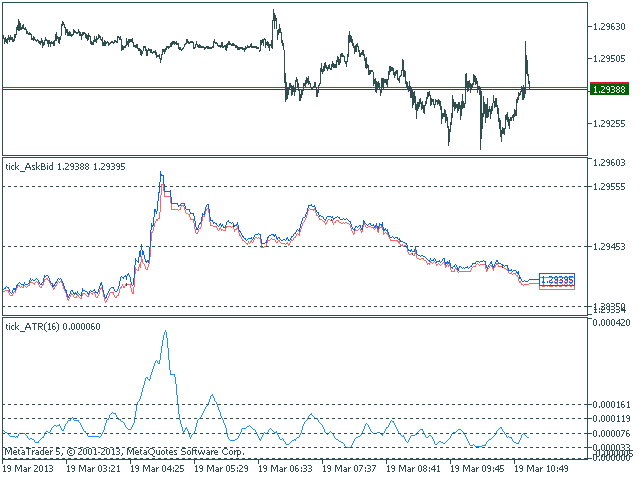
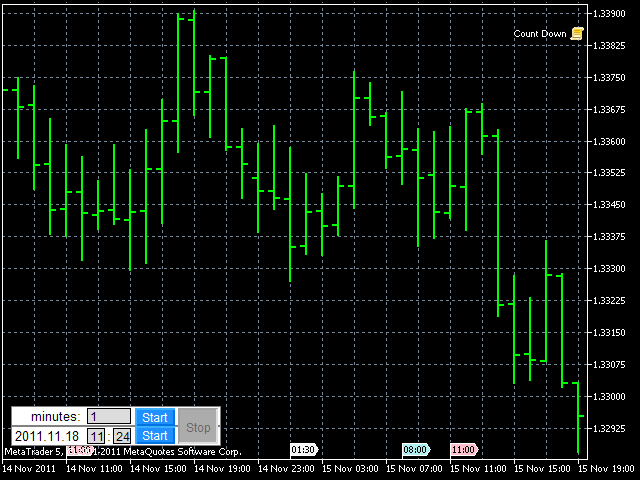
Price display method is colored candles.
The following values are displayed:
Open prices/High/Low/Close - as a colored candle. The default colors are as follows: red candle - the price is falling (Close value is less than Open one), green candle - the price is rising (Close value exceeds Open one), yellow candle - the price is equal to the previous one (Close value is equal to Open one), gray candle - the price corresponds to the missing bar.
Price levels - as horizontal dashed lines. They are often used as support/resistance levels.
Current Bid/Ask/Last prices - as horizontal lines. Display, color and line style are specified by a user.
External parameters:
Hedge Instrument Name - name of the symbol to be displayed on the chart that is synchronous to the main one. For example, "GBPUSD" (of course, quotation marks should be omitted when specifying a name).
Instrument Show Name - name that should be displayed in the indicator window. You can use a custom name for an instrument as its original name can be too long and contain unnecessary information. If this field is left empty, the instrument name will be used.
Show on Chart, days - limits the number of days displayed as a chart. Specified number of displayed days does not depend on the chart's timeframe.
Show Levels - show/hide price levels. If Yes, price levels are displayed on the chart.
Levels Step Size, points - distance between adjacent levels in points - it is usually set as multiple of 500 (the distance multiple of 400 points is often used for JPY pairs). Also, additional levels for a specified step are displayed.
Up & Down Round Levels Number - number of displayed price levels above and below the current price. If set to 4, the level closest to the current price (4 below and 4 above) is displayed.
Levels Line Color - color of the lines displaying price levels.
Levels Line Style - style of the lines displaying price levels (solid, dashed, etc.).
Scanning Interval, msecs - period of the data update on the chart. It is set in milliseconds (the value of not less than 100 milliseconds should be set).
Chart Color Schema - indicator's color scheme. The following schemes are available: light/dark/black on white/white on black.
Show Bid Line - show/hide Bid price location on the chart as a horizontal line. Line color and style are set as individual parameters.
Show Ask Line - show/hide Ask price location on the chart as a horizontal line. Line color and style are set as individual parameters.
Show Last Line - show/hide Last price location on the chart as a horizontal line. Line color and style are set as individual parameters. This price is valid for stock symbols (for example, for Russian FORTS market).
Bid Line Style - line style for Bid price on the chart (solid, dashed, etc.).
Ask Line Style - line style for Ask price on the chart (solid, dashed, etc.).
Last Line Style - line style for Last price on the chart (solid, dashed, etc.).
Bid Line Color - line style for Bid price on the chart.
Ask Line Color - line style for Ask price on the chart.
Last Line Color - line style for Last price on the chart.
Show Buffer's Value on Chart - show/hide display of numerical values for indicator buffers in the indicator window.
Debug Info Level manages sending messages to the terminal's log on the errors occurring when symbol data is received. Sending is disabled by default.
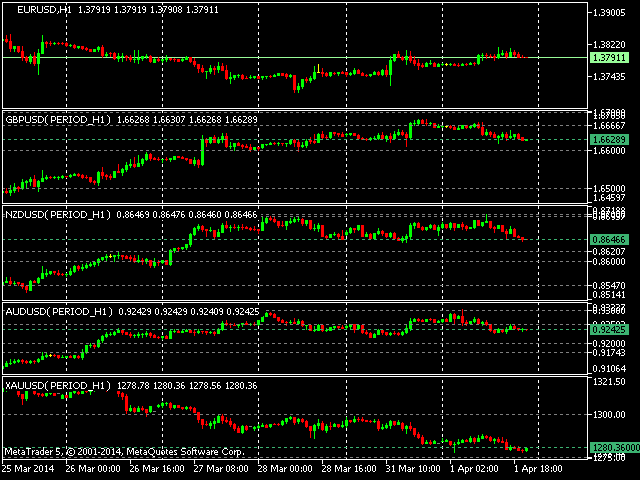
Fig. 1 displays the indicator working with Forex symbols. This example shows the convenience of the multicurrency analysis based on various trading strategies (for example, Elder's Triple Screen, seasonal trends, etc.), as well as the development of new strategies depending on the trader's preferences.
Fig. 2 shows similar example for Russian FORTS market.
Below is the offer for active users and all those who keeps reading to this line.
Please write all your suggestions on the Comments tab, so we can have a documentary proof of the ideas and see who the first author is.


 网络资源
网络资源