Normalized Volumes Indicator
When looking at the volume information that moves the market, a question arises: is it a strong or weak movement? Should it be compared with previous days? These data should be normalized to always have a reference.This indicator reports the market v
When looking at the volume information that moves the market, a question arises: is it a strong or weak movement? Should it be compared with previous days? These data should be normalized to always have a reference.
This indicator reports the market volume normalized between 0-100 values.
It has a line that smoothes the main signal (EMA).
The normalization of values occurs within an interval defined by user (21 bars on default).
User can also define any relative maximum, timeframe and number of bars to calculate.
Calculation: volNorm = (volReal - absMin) * (relMax - relMin) / (absMax - absMin) + relMin
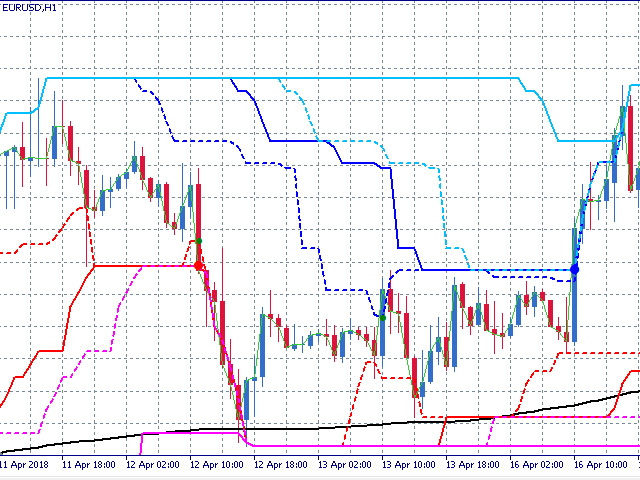
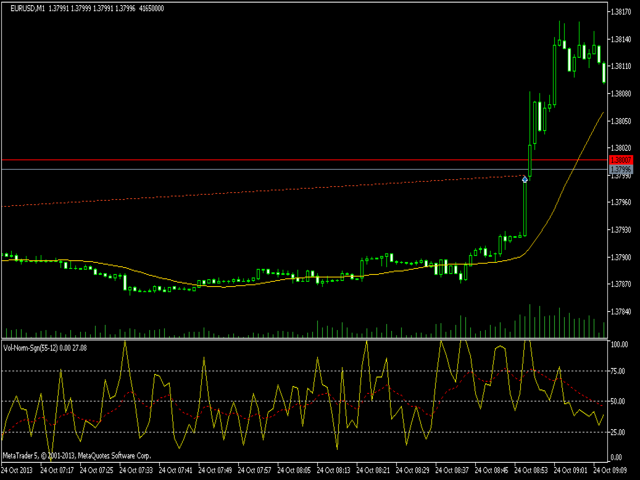
Pay attention to the signal line on the chart (M1, period 55, signal 12): the price increase is preceded by a phase, in which the volumes are below 50 and the price increase is preceded by an increase in volumes in zone 75.


 网络资源
网络资源