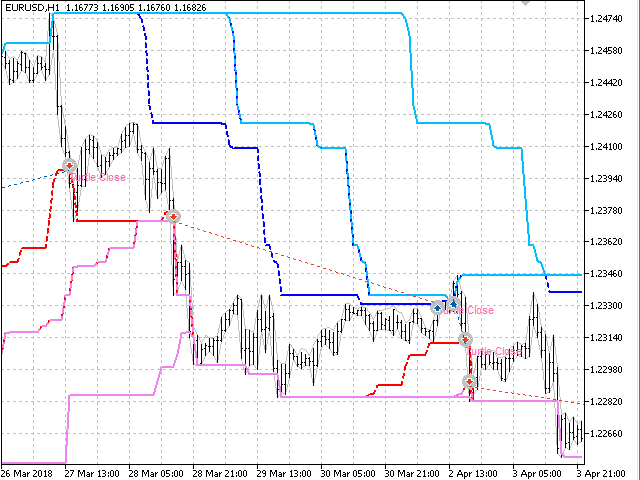
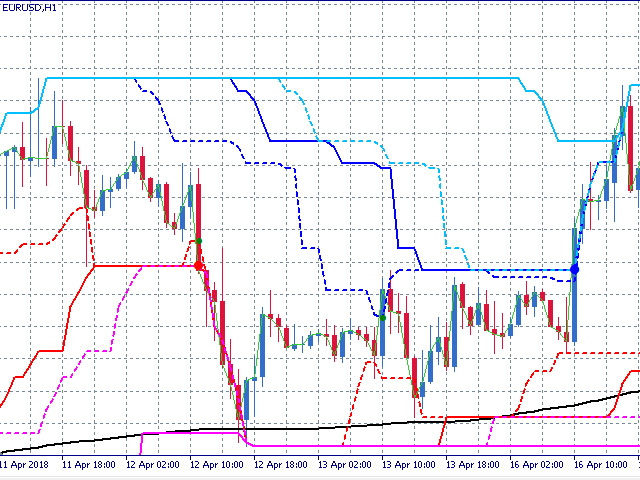
Normalized ATR three modes
Is the market volatile today? More than yesterday? EURUSD is volatile? More than GBPUSD? We need an indicator that allows us to these responses and make comparisons between pairs or between different timeframes. This indicator facilitates this task.R
Is the market volatile today? More than yesterday? EURUSD is volatile? More than GBPUSD? We need an indicator that allows us to these responses and make comparisons between pairs or between different timeframes. This indicator facilitates this task.
Reports the normalized ATR as three modes;
It has a line that smooths the main signal;
The normalization of values occurs within a defined interval by user (34 default bars);
The user can also define any symbol and timeframe to calculate and to make comparative studies.
Calculation modes:
ABS_max_min= (realATR-absMin)*(relMax-relMin)/(absMax-absMin) + relMin (between 0-100);
Z_score = (realATR - arithmeticMean) / standardDeviation;
MA_ref = realATR / MAvalue * 100 (SMA of normalization period);
General parameters:
Symbol: Set different graphic symbol to study, for example, correlation behavior;
ATR period: The number of bars to calculate ATR;
Normalization period: Time interval over which we calculate the normalization values;
Period smoothing: Period to calculate signal line (EMA);
TimeFrame: Provides the vision of ATR in different frames.
Advantages:
Reports the level of volatility a relative way: more than yesterday, less than a month ago, etc;
Facilitates the study of volatility compared between different pairs;
Reports the level of correlation between different pairs visually.


