Good Time
Indicator for Highlighting Any Time Periods such as Trade Sessions or Week DaysWe do we need it? Looking through the operation results of my favorite Expert Advisor in the strategy tester I noticed that most deals it opened during the Asian session w
Indicator for Highlighting Any Time Periods such as Trade Sessions or Week Days
We do we need it? Looking through the operation results of my favorite Expert Advisor in the strategy tester I noticed that most deals it opened during the Asian session were unprofitable. It would be a great idea to see it on a graph, I thought. And that was the time I bumped into the first problem - viewing only the Asian session on a chart. And hiding all the others. It is not a problem to find the work schedule of exchanges in Tokyo or Singapore, but how to highlight their operation time only and nothing else?
The second problem appeared later. For some reason all the deals performed on Thursdays were unprofitable, while on the other days everything went good. What was wrong with Thursdays so that my Expert Advisor couldn't cope with them? I started analyzing the situation, and so I needed to highlight all Thursdays on a chart. This was the second problem.
The third problem appeared when I decided to compare the price behavior between two sessions. I thought that the American session was somehow connected with the Asian one, so I needed to highlight both of them and remove all the rest. And that was the third problem.
Comparing these problems, I had come to a decision to start doing something, so I started developing an indicator that would solve all these problems. That is how the GoodTime indicator appeared.
GoodTime:
highlights any time periods, for example, sessions;
can highlight a selected day only, for example, Thursday;
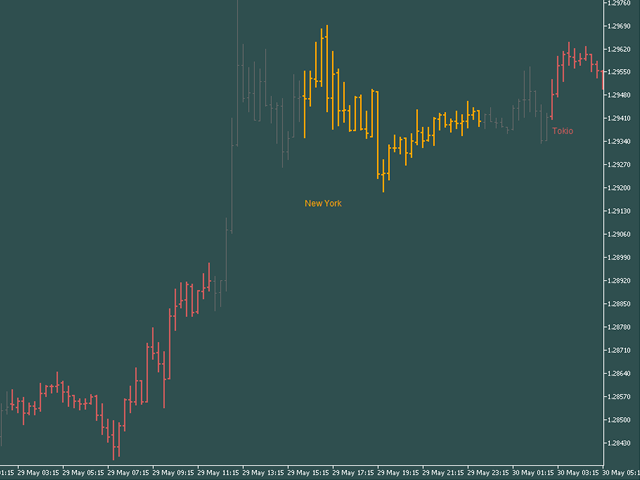
adds a caption to every highlighted period, for example, "Tokio THU";
highlights bars, candlesticks or lines automatically tracking the representation type selected for your chart;
highlights selected interval with vertical filling;
or by underlining;
or searches for a minimum and maximum value of the price at a selected time range and then highlights the range between the minimum and the maximum point.
Several instances of the GoodTime indicator can work on the same chart at the same time; they will highlight different periods. Thus you can highlight two trade sessions and compare them with each other.
GoodTime can be used for making statements and screenshots, where you can draw attention to specific bars or candlesticks on a chart. You can use it for analyzing Expert Advisors by highlighting trade sessions and week days on a chart for further examination.
GoodTime is also suitable for manual trading as it highlights the work time of your colleagues located in other time zones and general trade sessions.
You can always download a demo version of the indicator before purchasing it.
Wish you fair trends and may the luck be with you!


 网络资源
网络资源