Moving Ratio
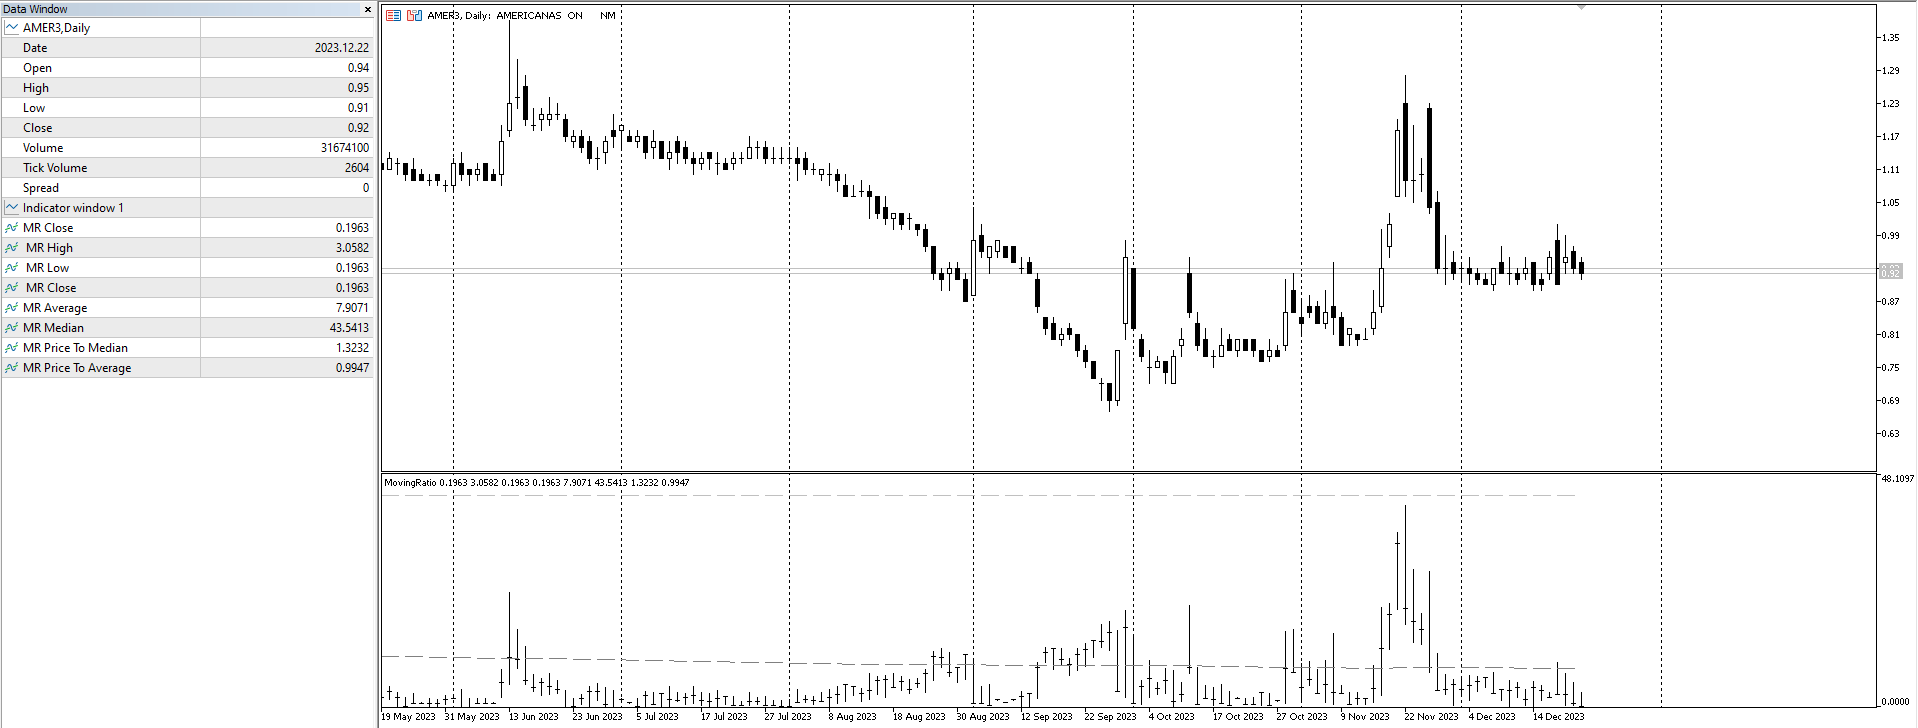
"Moving Ratio Candle" is used to check the distance of a candle to a theoretical pressure point. Furthermore, we have two points of interest, the first for the mean and the second for the median. This indicator uses the shape of bars and th
"Moving Ratio Candle" is used to check the distance of a candle to a theoretical pressure point. Furthermore, we have two points of interest, the first for the mean and the second for the median. This indicator uses the shape of bars and the line that crosses the bar from left to right is based on the calculation of the closing price for both sides. The rest follows a more standard calculation. The same could be done as a line, but I want to know the behavior of this indicator in relation to the OHLC price candle. So a simple line wouldn't tell me.
In the data part of the tool in order: the 4 bar data - OHLC; the average (which can be influenced by the multiplication factor); the median (not influenced by the multiplication factor); the price that must be reached to hit the median; finally, the value that must be reached to hit the average.
This indicator redraw and blink sometimes since I cant give enough attention. So I'm doing a test by putting it on the market for free.


 网络资源
网络资源