Trend Bands 5
147
0
2024-01-10
Bands are a form of technical analysis that traders use to plot trend lines that are two standard deviations away from the simple moving average price of a security. The goal is to help a trader know when to enter or exit a position by identifying wh
Bands are a form of technical analysis that traders use to plot trend lines that are two standard deviations away from the simple moving average price of a security. The goal is to help a trader know when to enter or exit a position by identifying when an asset has been overbought or oversold.
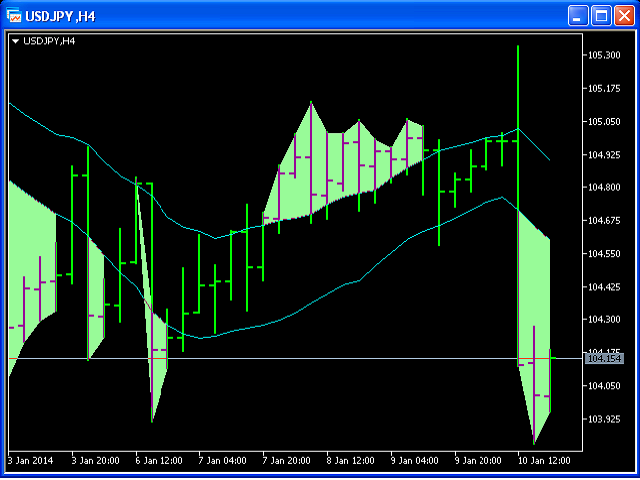
This indicator will show upper and lover bands. You can change input parameters nPeriod and nMethod to calculate those bands for each timeframe.
Aqua clouds represent up or down trends.


 网络资源
网络资源