Trading HUD 2
This is a complete and customizable Trading HUD (Head-Up Display) combining all important tools and information for professional trading in one window.Features:1. Display key indicators that most professionals consider for their trading decisionsCurr
This is a complete and customizable Trading HUD (Head-Up Display) combining all important tools and information for professional trading in one window.
Features:
1. Display key indicators that most professionals consider for their trading decisions
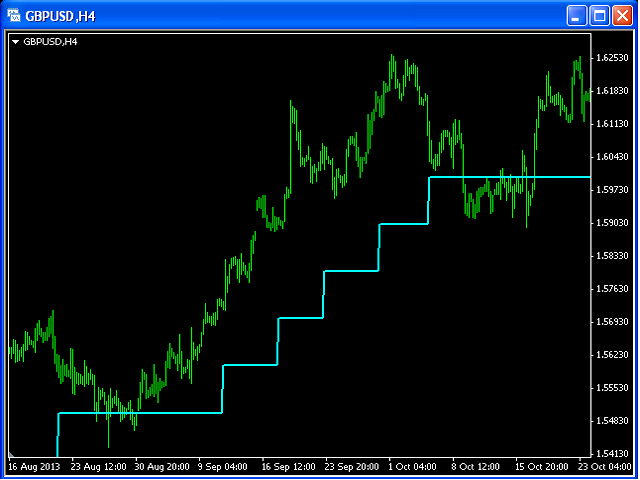
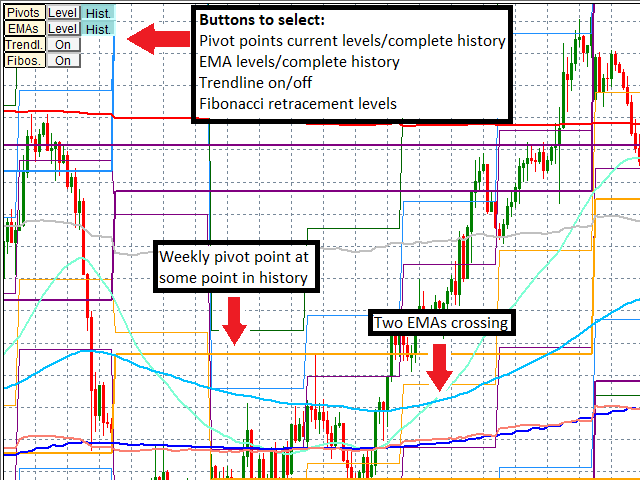
Current daily, weekly and/or monthly Pivot Points with 7 Levels (PP, S1, S2, S3, R1, R2, R3)
Complete history of daily, weekly and/or monthly Pivot Points
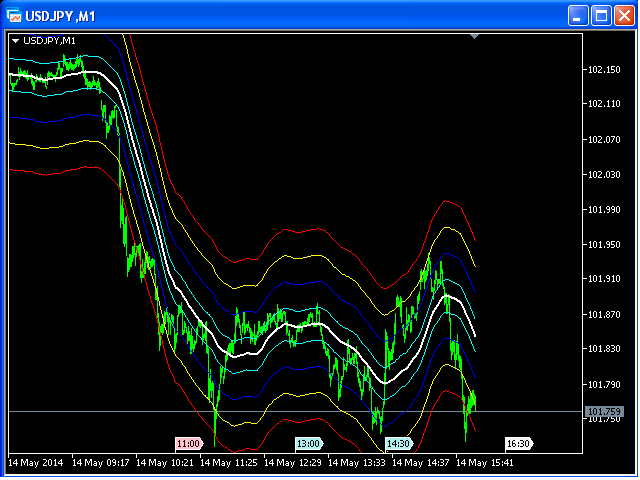
Current level of exponential moving averages (EMAs) from different timeframes. The User can define up to 10 EMAs
Complete history (!) of EMAs from different timeframes. With this tool you will be able to analyze at which EMAs to price has reacted in the past without switching timeframes. Note that every value is the correct value of that EMA at the specific moment. 100% exact calculation – no interpolation
Automatically draws Trendlines using multiple adjustable algorithms
Fibonacci Retracement Levels. The program will automatically determine appropriate fix points for multiple retracements. The retracements are numbered, colored according to their direction and shifted the further they reach back. The levels can be adjusted
2. Display trading results with the new concept of Standard Pips
When people are talking about their trading success I always hear them say something like “Today I made 50 Pips”, but 50 Pips on GBPNZD is obviously way less than 50 Pips on EURGBP. But even if you win 50 Pips on EURUSD at a price of 1.1000 you actually won more than if you had won 50 Pips on EURUSD at a price of 1.2000.
Therefore I define a Standard Pip as 1/10,000th of the current price.
Only this concept makes trade results comparable, even if you are only trading one currency.
The Info Area contains the following information:
Monetary profit on current symbol, all Forex symbols combined, and all NON-Forex symbols combined
Profit on current symbol, all Forex symbols combined, and all NON-Forex symbols combined in Standard Pips
Number of trades on current symbol, all Forex symbols combined, and all NON-Forex symbols combined
All these values depend on the date interval you choose.
The number of trades is not just the number of deals but the number of real trades. That means the following sequence would e.g. count as one trade:
Buy 0.1 Lot
Buy 0.2 Lot
Sell 0.15 Lot
Sell 0.15 Lot
The win/loss in Standard Pips with multiple entries/exits is weighted appropriately. This makes the Standard Pips win/loss the most meaningful number if you want to analyze your true trading success.
The size of the info area box can be adjusted. There also is a small button to temporarily hide the complete box if you need to see what is behind it.
3. Quick navigation between a large number of charts
Professional traders often trade on a large number of charts and sometimes it can be quite annoying if you e.g. want to trade the Dow Jones and re-check the USD-Indicator because first you have to click through 40 charts to reach it.
To make life easier there are customizable quick navigation buttons at the lower right corner of the screen. The user can define the appearance and the content of all buttons. Each button needs a text which will appear on the button (should be very short) and a “search text” which is a part of the according symbol. You can also define two alternative search texts using the separator “*”.
Example:
Button text: “Gold”
Button search text: “GOLD*XAU”
This means when you click the button, the program will look for an open chart containing “GOLD” or “XAU” in its name (on some brokers Gold will be “XAUUSD” on others “GOLD”).
Additionally, there will be one button for each chart with an open position indicating the current profit by its color, ranging from dark green to dark red.
4. Permanent information on Stop-Loss and Take-Profit
This feature enables you to always see what is at stake with each trade. That means on top of the Stop-Loss- and Take-Profit-line there will be the amount you win/lose once the according level is reached. It not only shows the amount in the account currency but also in percentage of the current account equity which is important for a solid money management.


 网络资源
网络资源