Market Profile FX
Market profile was developed by Peter Steidlmayer in the second half of last century. This is a very effective tool if you understand the nature and usage. It's not like common tools like EMA, RSI, MACD or Bollinger Bands. It operates independent
1. Price Histogram
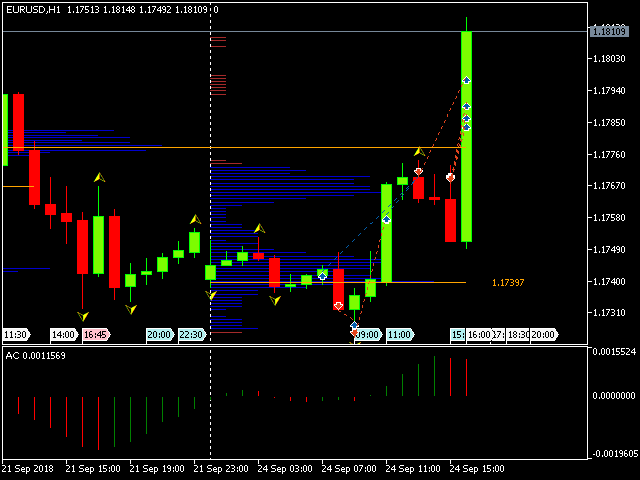
The Price Histogram is a very reliable tool. It's a bit intuitive but extremely effective. The price histogram simply shows you the "most convenient" trading points of the market. This is aa leading indicator, because it shows the points where market can change its direction in advance. The indicators like moving averages or oscillators cannot specify the exact points of resistance and support, they can only show the fact whether the market is overbought or oversold.
Usually, the Price Histogram (or Market Profile) is applied to 30 min. price charts to study the market activity during one day. I prefer to use the 5 min. charts for stock markets and 15-30 min. charts for FOREX.
2. Point of Control
What does POC show? The price that is remembered by most of traders. The longer market is traded at this price, the longer market remembers it.
Psychologically POC acts as a center of attraction.


 网络资源
网络资源