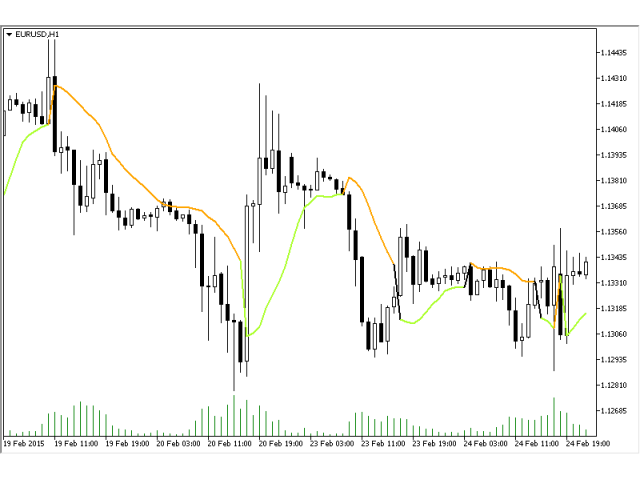
Delta EMA is a momentum indicator based on the changes of closing price from one bar to the next. It displays a histogram of the exponential moving average of those changes, showing magnitude and direction of trend. Positive delta values are displayed as green bars, and negative delta values are displayed as red bars. The transition from negative to positive delta, or from positive to negative delta, indicates trend reversal. Transition bars that exceed a user specified value are displayed in bright green or bright red, alerting the trader to potential buy and sell signals. The screenshot shows a transition bar displayed as a buy signal because it exceeds the default threshold value on the H1 chart of the EUR/USD currency pair. The transitions back to negative delta show good exit points for the trade. The indicator is expressed in terms of percent change, averaged over the number of bars specified by the user, so settings that work for one currency pair can be applied to other pairs.
Input variables
EMA periods: The number of bars in the exponential moving average of delta. This number determines the alpha or smoothing factor of the moving average.
Alpha of EMA: Here the user can specify the alpha of the EMA directly. If this value is zero, alpha is calculated from the "EMA periods" input variable. If it is greater than zero, it becomes the value of alpha and the value of "EMA periods" is ignored. The normal range of alpha is greater than zero, less than or equal to 1. When the value is 1, the calculation of EMA does not take the previous value of the EMA into account, and the EMA becomes the current delta.
Signal threshold: A transition bar becomes a signal bar if it exceeds this value in the positive or negative direction. In that case, it is displayed as a bright green or bright red bar, and an audible alert can be sounded and an e-mail alert can be sent.
Sound alert: When set to true, indicator sounds an audible alert when a transition bar exceeds the value of input variable "Signal threshold," becoming a signal bar. The alert is sounded the first time the current bar exceeds the threshold value, and it is sounded when the close of a bar exceeds the threshold value.
E-mail alert: When set to a value greater than zero, the indicator sends an e-mail, to the a address specified by the user in Metatrader settings (Tools\Options\E-mail), when a transition bar exceeds the value of input variable "Signal threshold." Set this value to 2 to send an e-mail alert the first time the current bar exceeds the threshold value and when it closes above that value. Set this value to 1 to send an e-mail alert only when a bar closes above the threshold value. Set this value to 0 to disable e-mail alerts.
Print deltas: When set to true, the value of the EMA of delta at the open of every bar is printed to the terminal.
The default values of "EMA periods" and "Signal threshold" work well on the H1 chart. Smaller values of "Signal threshold" work better on shorter timeframes, where changes from one bar to the next are less, and larger values work better on longer timeframes. Optimal values can be found by using the output of Delta EMA as input to an Expert Advisor and running the EA in Strategy Tester. The EMA of delta for the current bar not yet completed is updated at every incoming tick and is displayed in the upper-left corner of the indicator's window. This value, or the value at the close of any previous bar, can be accessed by an external Expert Advisor calling the iCustom() and CopyBuffer() functions. The link to iCustom() provides an example of how to do that. The number of the indicator buffer to access is 0. That buffer uses reverse indexing order, so the index for the value of the EMA of delta for the current bar is 0, the index for the value at the close of the preceding bar is 1, the index for bar before that is 2, and so on. Note that if more than one value is copied, the order of indexing can be preserved in the destination buffer by first calling ArraySetAsSeries() like this: ArraySetAsSeries(EA_Buffer, true).

