Strong Trends With Magic Entries MT5
With this system you can spot high-probability trades in direction of strong trends. You can profit from stop hunt moves initiated by the smart money!Important InformationHow you can maximize the potential of the scanner, please read here: www.m
With this system you can spot high-probability trades in direction of strong trends. You can profit from stop hunt moves initiated by the smart money!
Important Information
How you can maximize the potential of the scanner, please read here: www.mql5.com/en/blogs/post/718109
Please read also the blog about the usage of the indicator: Professional Trading With Strong Momentum.
With this system you have 3 reliable edges on your side:
A strong trend (=high probability of continuation)
A deep pullback (=the price should not be there within a strong trend! Is it a stop hunt?)
A strong rejection of the pullback (=It was most probably only a stop hunt. Let's enter!)
The rules for a short trade are:
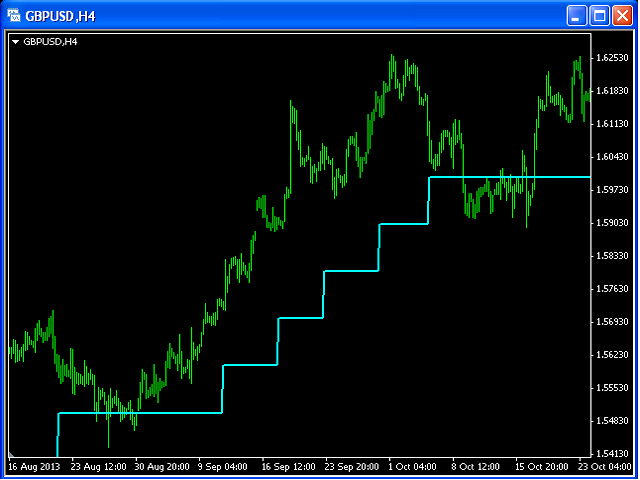
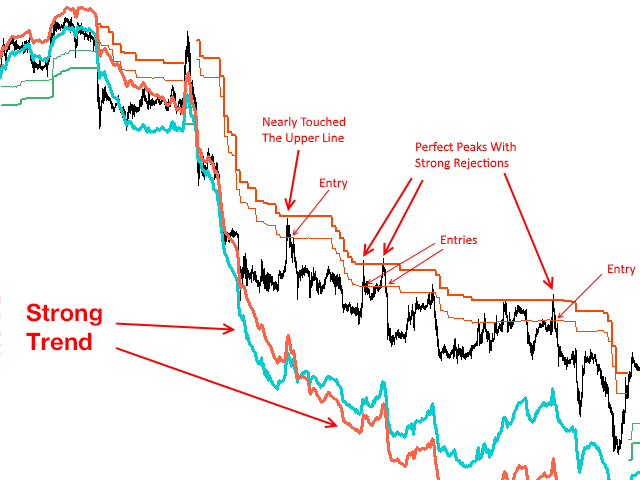
The thick blue and thick orange lines are strong below the price (strong downward trend indicated, more about the strength later)
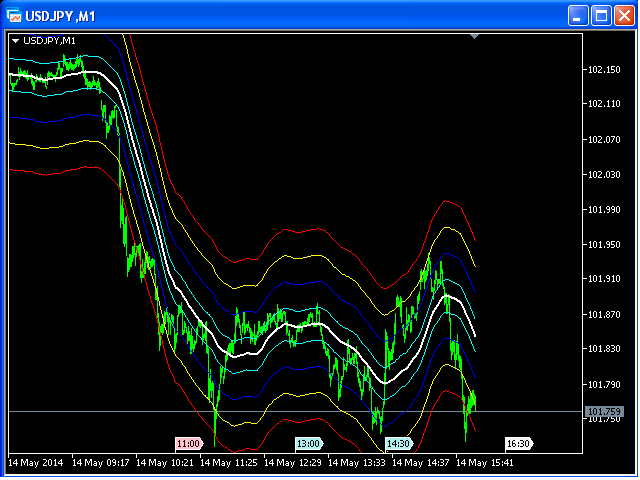
At the same time there must be 2 thinner orange-red lines (they look like stairs) above the price (this confirms the price action within the trend)
The price then have to jump above the 2 thinner orange-red lines (or at least between them) and then must be rejected below the two thinner lines again. This forms a peak (an inverted V). The peak should consist of maximum 4 candles.
The entry signal is the move below the lower line of the 2 thinner orange-red lines.
The rules for a long trade are:
The thick blue and thick orange lines are strong above the price (strong upward trend indicated)
At the same time there must be 2 thinner green lines (they look like stairs) below the price (this confirms the price action within the trend)
The price then have to jump below the 2 thinner green lines (or at least between them) and then must be rejected above the two thinner lines again. This forms a peak (a V). The peak should consist of maximum 3-4 candles.
The entry signal is the move above the upper line of the 2 thinner green lines.
Additional Edges:
You will have an additional edge if you only trade the FIRST signal within a trend! The third screenshot shows what I mean with FIRST signal.
You will a further additional edge if you trade only the signal in direction of an edge of the bigger timeframe. Screenshots 4, 5, 6 and 7 show what
ATTENTION: You need 3800 candles on the chart for the orange line to be drawn! The big amount of candles (3800) is also the reason why the indicator only works for time frames lower than D1. Most brokers don't provide 10+ years of historic candles.
Parameters
candlesCalculated: the number of candles for which the orange and blue lines are calculated. A lower value uses less computer ressources
distanceInnerLine: the distance between the lines which looks like stairs expressed in multiples of the ATR-indicator
showBand: True = Yes, False = No - if true, then the black band is shown. The band is normally not needed. During backtesting it can be usefull.
xxx: is used for internal calculation. Must be 0. Don't touch/change this value! The indicator calls itself (recursive calls) with different values for xxx, yyy and zzz to calculate the values of different time frames. Therefore xxx, yyy and zzz must not be configured manually.
yyy: is used for internal calculation. Must be 0. Don't touch/change this value! The indicator calls itself (recursive calls) with different values for xxx, yyy and zzz to calculate the values of different time frames. Therefore xxx, yyy and zzz must not be configured manually.
zzz: is used for internal calculation. Must be 0. Don't touch/change this value! The indicator calls itself (recursive calls) with different values for xxx, yyy and zzz to calculate the values of different time frames. Therefore xxx, yyy and zzz must not be configured manually.


 网络资源
网络资源