Fractals true extremums MT5
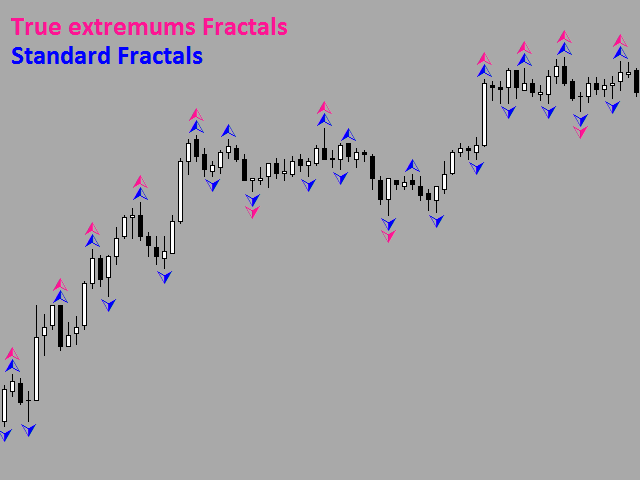
Fractals true extremums is a modification of the Fractals indicator. The indicator sorts out weak fractals leaving only the ones that are significant for searching the chart extreme points. The sorting is performed during fractals construction.
Fractals true extremums is a modification of the Fractals indicator. The indicator sorts out weak fractals leaving only the ones that are significant for searching the chart extreme points. The sorting is performed during fractals construction. The old data does not change. Only the last value can change (just like in the standard Fractals indicator). The indicator can show lines indicating Fractals from higher timeframes.
The product can be used by EAs for comparing price extreme points on charts of various instruments, as well as applied instead of the standard Fractals indicator for obtaining more reliable entry points and support & resistance levels.
The standard Fractals indicator generates a large number of extreme points. The two methods are usually used to sort them:
Fractals from older timeframes (where there is the same issue of potential false signals).
Methods of smoothing fractals by calculating them on 7, 9 and more standard bars rather than on 5 ones. However, this method may skip a really important fractal and strongly depends on the current situation on the chart. In other words, it may be more feasible to use 5 bars on some part of the chart, 9 bars on some other one, etc.
Fractals true extremums indicator applies the principle of the intellectual sorting of fractals. It requires no selection of certain settings from users in order to fit the indicator into the chart. On upward trends, the indicator mainly shows the upper fractals formed above the previous ones until the upward trend does not end. On downward trends, the situation is inversed. If the indicator assumes the presence of a flat, it sorts out most of the fractals except the ones that form new highs and lows.
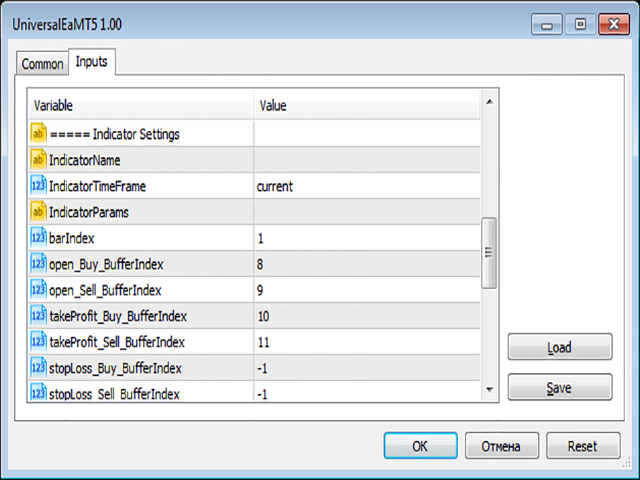
Параметры
To wait bar closing - true - only show Fractals on closed bars. Fractals of the current bar and higher timeframes will be shown one bar later, but will not be redrawn. false - normal mode for showing fractals (the last one can be redrawn in this case).
TIMEFRAME_1 - choose timeframe for drawing level 1.
TIMEFRAME_2 - choose timeframe for drawing level 2.
TIMEFRAME_3 - choose timeframe for drawing level 3.
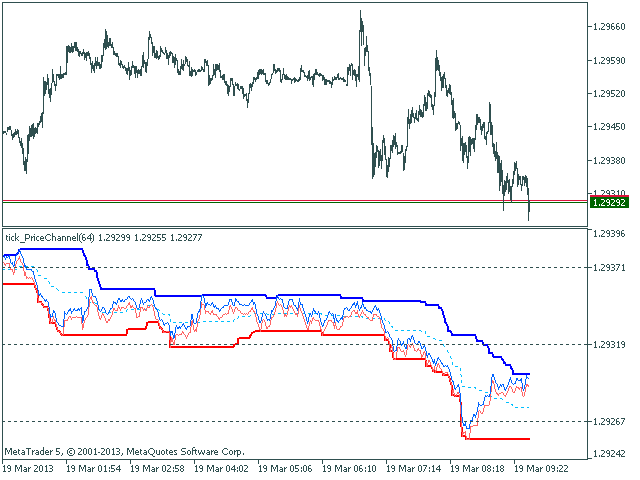
A higher timeframe can be selected in parameters TIMEFRAME_1,2,3. These values will be shown as lines on the chart. The lines form support and resistance levels. If any of the lines is not used, set it to the current or lower timeframe.
The indicator works best on the charts without price gaps – on highly liquid instruments or older timeframes.
The terminal version 1861 or higher is required for the indicator operation.


 网络资源
网络资源