Two Fibonacci lines with Buy and Sell arrows MT5
Fibonacci sequence is defined by integer sequence: 0, 1, 1, 2, 3, 5, 8, 13, 21, 34, 55, 89, 144, ...By definition, it starts from 0 and 1, the next number is calculated as a sum of two previous numbers.Instead of the standard moving average, the indi
Fibonacci sequence is defined by integer sequence: 0, 1, 1, 2, 3, 5, 8, 13, 21, 34, 55, 89, 144, ...
By definition, it starts from 0 and 1, the next number is calculated as a sum of two previous numbers.
Instead of the standard moving average, the indicator uses the following calculation of average price: Bar0 + Bar1 + Bar2 + Bar3 + Bar5 + Bar8 + Bar13 + Bar21 + ...
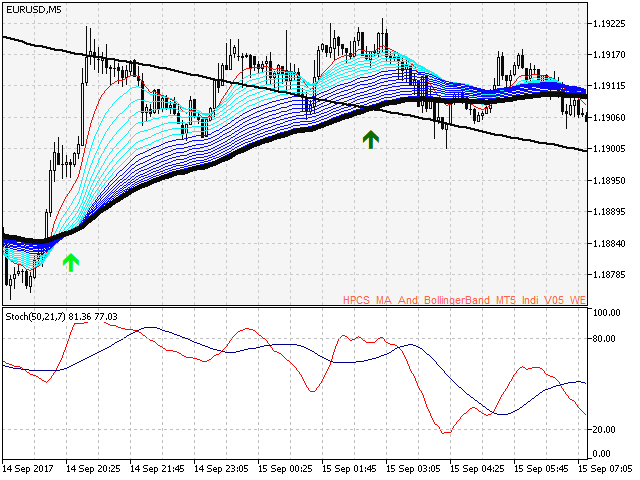
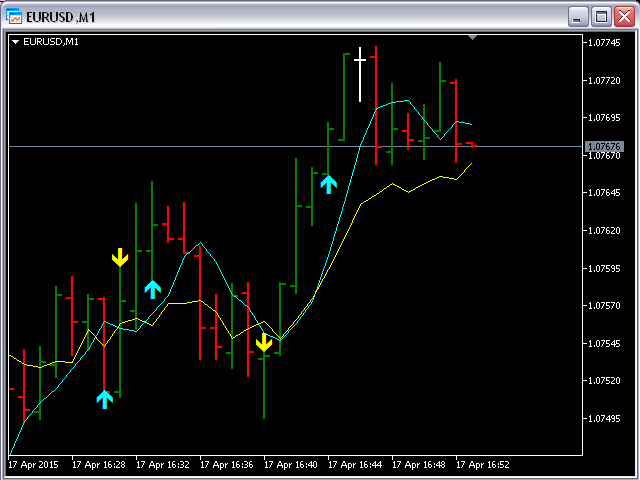
This indicator shows 2 moving Fibonacci lines and arrows when 2 these lines crossing each other.
If an Aqua line is crossing a Yellow line from below then an Aqua arrow appears. This is an indication of an Uptrend.
If an Aqua line is crossing a Yellow line from above then a Yellow arrow appears. This is an indication of a Downtrend.
Input parameters
FiboNumPeriod_1 - numbers in the following integer sequence for Fibo Moving Average 1.
nAppliedPrice_1 - applied price.
FiboNumPeriod_2 - numbers in the following integer sequence for Fibo Moving Average 2.
nAppliedPrice_2 - applied price.


 网络资源
网络资源