Actual Tick Footprint Volume Chart
This new unique indicator Actual tick footprint (volume chart) is developed for using on Futures markets, and it allows seeing the volume of real deals right when they are performed. The indicator Actual tick footprint (volume chart)&n
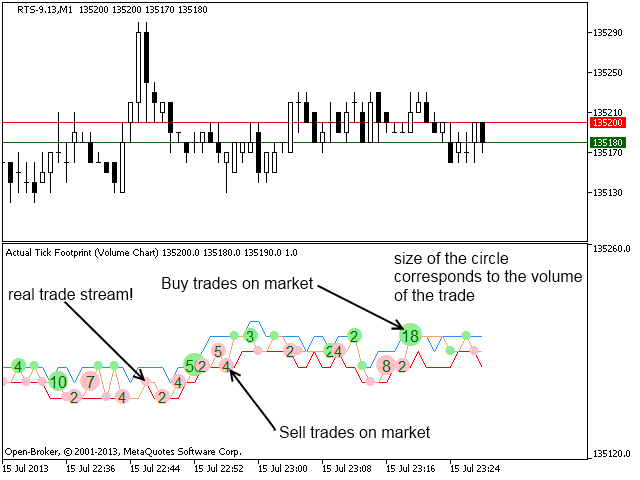
This new unique indicator Actual tick footprint (volume chart) is developed for using on Futures markets, and it allows seeing the volume of real deals right when they are performed. The indicator Actual tick footprint (volume chart) represents a greatly enhanced tick chart that includes additional information about the volume of deal performed at a specific price. In addition, this unique indicator for MetaTrader 5 allows to clearly detecting a deal type – buy or sell.
Alike the standard tick chart, the indicator draws three lines in the window:
Bid line.
Ask line.
Last line. Circles with digits displayed on it indicate the volume of a deal performed at the given price. The size of circles is proportional to the volume of deals, and the color is for the type of deals. Red circle indicates that a deal has been performed by the Bid price (interpreted as Sell), and green circle indicates that a deal has been performed by the Ask price (interpreted as Buy).
Information provided by this indicator is essential for scalping on Futures markets as it allows detecting many patterns and get information which is not available to ordinary traders. For example:
Deals with extremely high volume. Further, the price of that deals will probably be a resistance level.
Deals of what type are performed in a given range - Buy or Sell. It allows estimating a direction of exiting from accumulation.
Behavior of traders during an impulse and passing a level - whether everybody buys or sells at a sharp change of the price?
… and many other situations.
The indicator includes the built-in system of filtration, and it displays only new deals that are performed at a changed price or with a greater volume. 1 lot deals are displayed but they don't have captions on the chart; it allows concentration on main information.
I recommend attaching the indicator Actual tick footprint (volume chart) to М1 or М5 chart and the selecting the best scale. It will allow taking optimal decisions when scalping and when searching for an optimal entry to the market on a longer period.
To understand the behavior of participants of the market and to interpret the volumes, I recommend using this indicator together with my other development – the product Actual depth of market chart which displays the market depth histogram.
The parameters of the indicator allow setting up the chart appearance:
Ticks on chart – number of last displayed deals.
Scale in pips – height of the vertical scale in points. You should adjust the value considering the current volatility.
Color volume buy – color of a buy deal marker.
Color volume sell – color of a sell deal marker.
Color label – color of a volume caption on a deal marker.
Pay attention to the following features:
The indicator will not work in the strategy tester, only on a real market. You can see how it works on the video.
The indicator will work only on the instruments with real volumes of deals available. First of all, it will be interesting for trades on the FORTS market and other stock markets accessible through MetaTrader 5.
The indicator displays information only when it is launched. The indicator cannot display information for the time before it was started.


 网络资源
网络资源