DWMACD
DWMACD - Divergence Wave MACD. The indicator displays divergences by changing the color of the MACD histogram. The indicator is easy to use and configure.For the calculation, a signal line or the values of the standard MACD histogram can be used. You
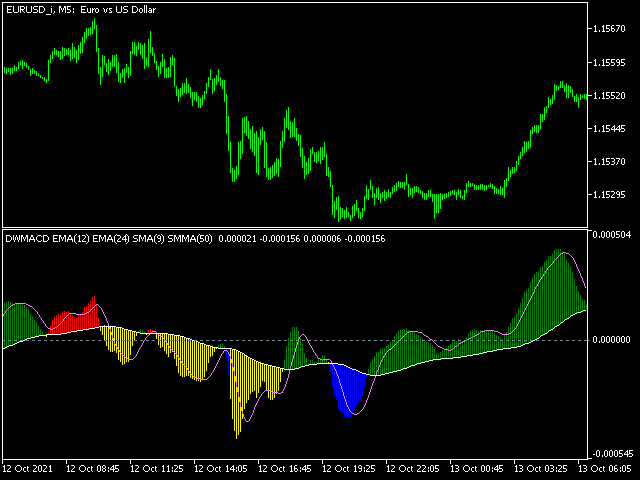
DWMACD - Divergence Wave MACD. The indicator displays divergences by changing the color of the MACD histogram. The indicator is easy to use and configure.
For the calculation, a signal line or the values of the standard MACD histogram can be used. You can change the calculation using the UsedLine parameter. It is advisable to use a signal line for calculation if the histogram often changes directions and has small values, forming a kind of flat. To smooth the histogram values set the signal line at UsedLine and a small period (2-5). As the period increases, the indicator lags behind the price (which applies to any indicator).
The indicator is calculated at the current price (close).
You can use your own moving average values in the settings. It is possible to use 4 standard types of moving averages (SMA, EMA, LWMA, SMMA). The CONST type is also introduced - this is a straight line (constant value). When using CONST, the value is taken from the period of the specified line. You cannot use CONST to build the MACD itself. Can only be used when drawing a terminator line. The terminator line divides the histogram into upper and lower parts. In the standard MACD, this is the zero line. Those. if you want to use standard values with a zero terminator, use the CONST for the terminator line with a period of 0. In this indicator, the terminator can be a moving average calculated from the base calculated line specified in the UsedLine parameter. Accordingly, the divergence is calculated as the difference in the deviation of adjacent unidirectional peaks from the terminator line.
The signals of this indicator are divergence signals. This is not necessarily a reversal, but definitely a weakening of the trend. With other positive conditions, it is worth entering the market using this indicator when the terminator line is broken by a divergent wave, expecting a long trend. It is also possible that the emerging divergence is not justified and the price continues to move. On the histogram, this will look like the color of the divergence, replaced by the color of a simple movement. In this case, the price movement will continue at least one more wave (as a rule).
The divergence colors correspond to the intuitive: blue - looking for purchases, red - sales.
Note: the next divergence cancels the previous one!
In my opinion, the indicator demonstrates the best results with default settings, but you can find parameters more suitable for you.
Have a successful trading!


 网络资源
网络资源