Market Impulse
This indicator uses volume and volatility information to indicate the trend or to indicate the market reversion/correction. There are 2 indicators in one. The indicator works in two styles: values per candle and accumulated values.Using the volume an
This indicator uses volume and volatility information to indicate the trend or to indicate the market reversion/correction. There are 2 indicators in one. The indicator works in two styles: values per candle and accumulated values.
Using the volume and volatility information, when well adjusted, this indicator has a good probability to indicate the right direction, both in lower (M1, M2, M5) and higher (M15, M30) timeframes.
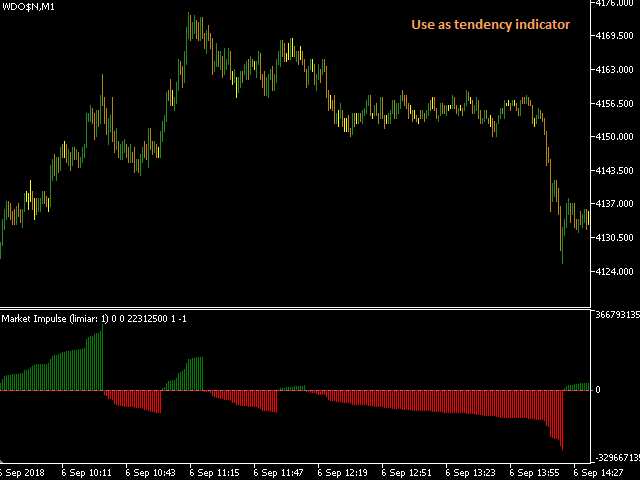
Strategy 1: Trend indicator
Indicates the operation direction. To use it as a trend indicator, follow these steps:
Choose the symbol and desired timeframe
Adds the indicator and sets the parameters:
"Acumulate values": "Yes"
"Accumulation flip threshold": zero
"Update threshold when breaks": "No"
"Accumulation type": "Normal"
Verify if you can easily identify the trends. Otherwise, gradually increase the "Accumulation flip threshold" until be ok.
Strategy 2: fast market reversion/correction
Indicates the moment that probably will be a market correction or reversion. Use it in fast operations. To use it as an indicator, follow these steps:
Choose the symbol and desired timeframe
Adds the indicator and sets the parameters:
"Acumulate values": "No"
"Accumulation flip threshold": zero
"Update threshold when breaks": "Yes"
Whenever the negative (red: Limiar -) or positive (green: Limiar +) threshold line increases, probably the price will turn on the direction (or by a reversion or by a correction). By example: If the positiv threshold raise, should be a good momente to sell and close this position some candles ahead.
The other parameters serve to allow a finer adjustment for both strategies.
Parameters:
Volumes: The volume type.
Tick (0): tick volume
Real (1): real volume
Applied to: Which candle params to use to volatility.
HILO (0)
Open and Close (1)
Open (2)
Close (3)
OHLC (4)
Update threshold when breaks: Will the threshold be changed when the bar raise the value?
No (1)
Yes (2)
Mininum threshold: Minimum threshold to start
Accumulate values: Toggle to accumulate consecutive same direction volatility values.
No (1)
Yes (2)
Accumulation type: Used only when Accumulate values is on.
Normal: Uses a relative candle variation
Discrete: Uses a fixed increment
Signal: Show only the operation signal
Accumulation flip threshold: Max volatility value that the indicator tolerates to put a reverse volatility in the current accumulation. Used only when "Accumulate values" is setted to "Yes"
Show balance line: Works only when Accumulation type is Normal.
Accumulate balance line values:
No (1)
Yes (2)
Show time markers: Plots a vertical line whenever the threshold is raised. For performance reasons this feature only works on the current day (the previous days will never plot the lines)
Programmers: This indicator was optimized for use with expert advisors, it does not redraw! EA should wait for the candle to close. Do not act upon incomplete candles (otherwise the EA may act on a false signal).


 网络资源
网络资源