CrossCorrelation 1
The indicator is designed to calculate the correlation between major pairs and display cross-pair of overbought or oversold labels on the price chart.The idea is that strong divergences of major pairs lead to an exit from the "equilibrium"
The idea is that strong divergences of major pairs lead to an exit from the "equilibrium" of the corresponding cross pairs. With sufficiently large divergences, which are displayed by the indicator, the cross-pair is usually corrected by entering the "equilibrium". For example: when working on EURAUD pair, the difference for the period specified in the settings for EURUSD and AUDUSD pairs is calculated and, if the difference exceeds the set threshold, the corresponding label is displayed on the chart. For major pairs, labels are displayed when the price changes by the set threshold.
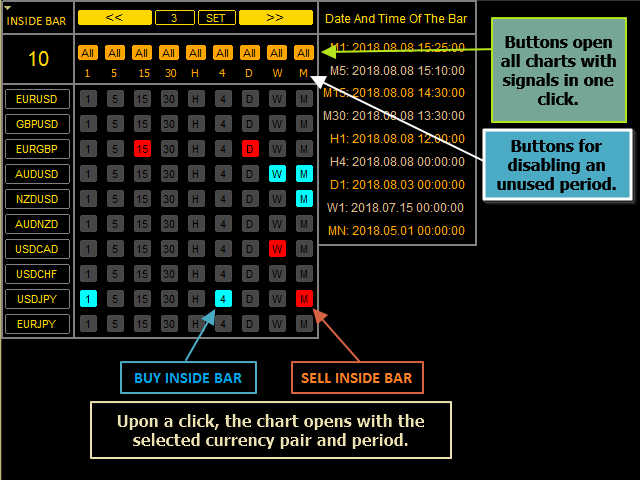
Red labels are displayed for the overbought zone and blue labels - for the oversold zone.
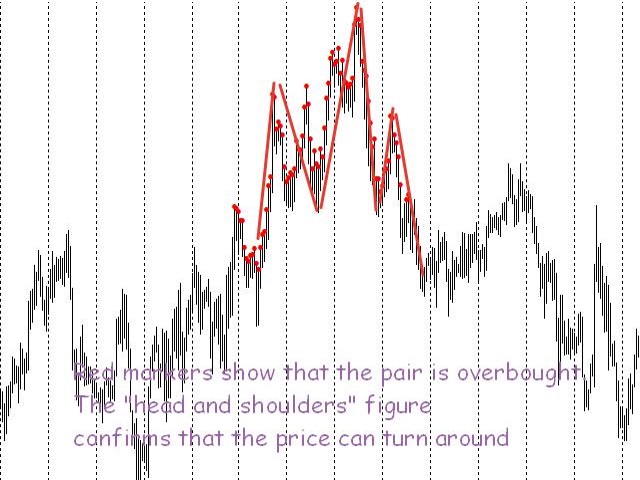
The indicator does not display (not always) immediate changes in the direction of the price movement, which should be confirmed by other methods (for example: reversal figures, margin levels).
Parameters
bars to calc - number of bars to calculate the correlation (default is 240)
Levels (%) - percentage of major pairs divergence, above which the corresponding labels are displayed on the chart (default is 2).


 网络资源
网络资源