CME CallPut Option Ratio MT5
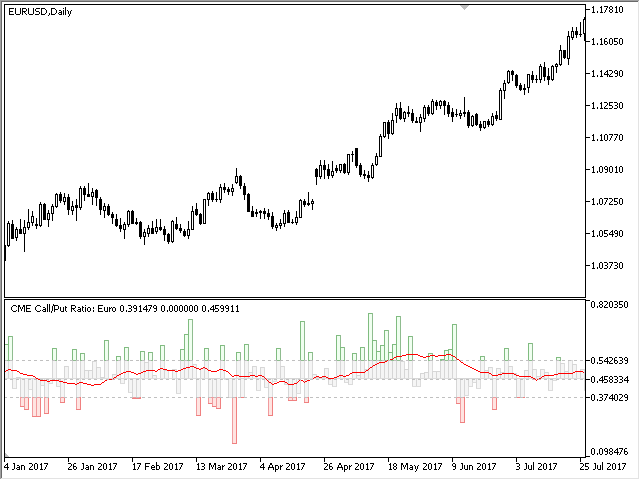
Call/Put Ratio is one of the most well-known indicators of the market sentiment. The indicator has been developed by Martin Zweig. It is based on real volumes of the CBOE option market. As we know, a Call option gives its owner the right to buy the u
Call/Put Ratio is one of the most well-known indicators of the market sentiment. The indicator has been developed by Martin Zweig. It is based on real volumes of the CBOE option market. As we know, a Call option gives its owner the right to buy the underlying asset at a predetermined price. A Put option gives the right to sell it. Thus, increasing volumes for Call options indicate the increasing demand. The growth of Put option volumes shows that supply starts exceeding demand. If we divide the volume of Call options by the total trading volume, we get a ratio showing the share of purchases relative to the total market share. It varies from 0 to 1 and is a high-frequency oscillator. The indicator allows us to use not only the volumes of option markets, but also the levels of their open interest as a calculation base enabling us to analyze the markets more deeply.
The indicator shows three zones:
Supply and demand are approximately equal (gray area);
Demand significantly exceeds supply (green area);
Supply significantly exceeds demand (red area).
Any market is characterized by a frequent change of states: after a rapid growth, there is a period of active selling, and on the contrary, a strong selling may be followed by an inexplicable period of growth. Call Put Ratio identifies the change of these phases and shows you when you can open a long or short position. Buy when CallPut Ratio goes into the green zone, provided that it was in the red one a few bars ago. On the contrary, sell when the indicator has moved to the red zone from the green one. You can also follow the signal of the red signal line: buy when its fall is replaced by growth, and sell when its growth is replaced by fall.
You can find more details about the indicator in the book "Trading Against the Crowd: Profiting from Fear and Greed in Stock, Futures and Options Markets" by John Summa.
The data on the option volumes ratio are taken from one section of the "daily bulletin" - report of the CME, published weekly. This section is called Daily Volume, it is available as Excel files on the official ftp server of the exchange. To update the data on CallPut Ratio, simply copy the corresponding reports to the indicator folder. Detailed instructions on performing the update can be found in the blog How to update CME reports on your PC. The demonstration mode (during testing) does not require the data, the indicator loads them from its internal memory. However, updating the reports is not possible in the demo version, therefore, the CallPut Ratio is displayed with some delay in this mode. The indicator works on any timeframe, but the data are available only for the daily timeframe; therefore, the suggested working chart period is D1. Nevertheless, the volumes of the current trading day are always available. They are updated several times during the trading session.
Inputs:
Color Theme - select one of the indicator's three color schemes;
Type of CME Volume - one of the CME real volume types, including open interest;
Stundart Deviation - standard deviation ratio, beyond which the CallPut Ratio moves to the red or green area;
Period of Signal Line - averaging period of the moving average;
Auto Detect Report Name - true means the necessary reports are downloaded automatically. Otherwise, the reports specified in the following two parameters are downloaded instead;
Call Option Name - Call option name to be downloaded;
Put Option Name - Put option name to be downloaded.
Update Frequency Min - frequency of updating data from the file base. 0 - updates disabled, 1 - updates occur once a minute.


 网络资源
网络资源