Nine Lives of PSAR MT5
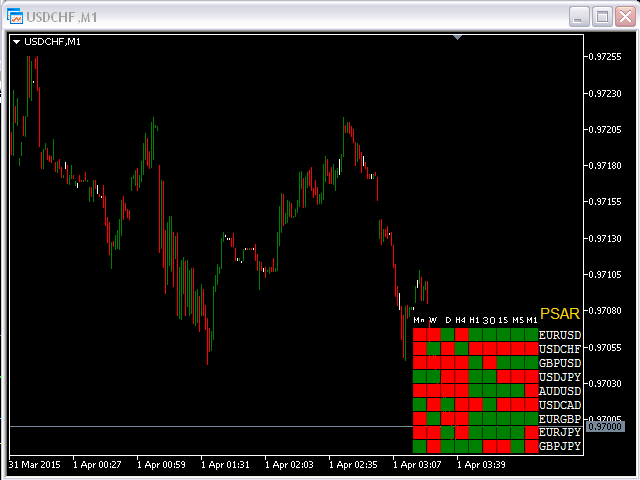
This indicator shows an Up trend (Green square) if a parabolic SAR value is below the current price, and Down trend (Red square) if a parabolic SAR value is above the current price from all Time Frame for
This indicator shows an Up trend (Green square) if a parabolic SAR value is below the current price, and Down trend (Red square) if a parabolic SAR value is above the current price from all Time Frame for each currency pairs.
Input parameters
from Symb1 to Symb9 — You may change any of these Symbols to any legal currency pair existed on your platform.
step=0.0; — Represents the acceleration factor for PSAR indicator.
maximum=0.2; — Maximum value for the acceleration factor for PSAR indicator
SymbColor=clrWhite; — You may change the color of all labels.
Attention
Before using this indicator you have to open all charts (all TF) for all 9 currency pairs.


 网络资源
网络资源