Nine Lives of RSA MT5
This indicator shows data from 9 currency pairs by your choice for all 9 Time Frames.If a digital value of the RSI is less or equal to DnLevel = 30 (or whatever number you decided to put) then a Green square will appear. This is potentially
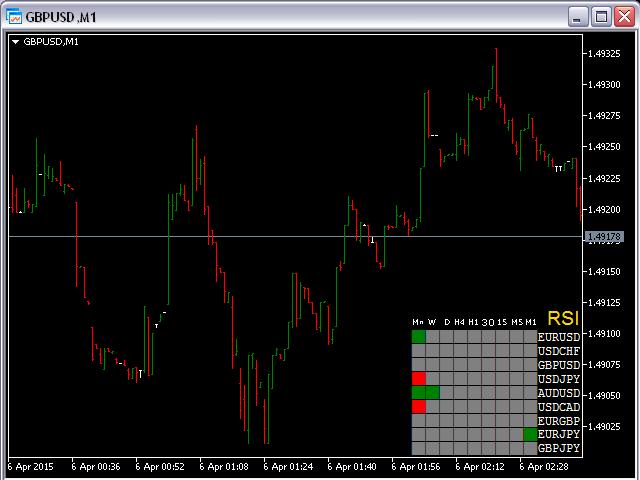
This indicator shows data from 9 currency pairs by your choice for all 9 Time Frames.
If a digital value of the RSI is less or equal to DnLevel = 30 (or whatever number you decided to put) then a Green square will appear. This is potentially an oversold condition and maybe a good time to go Long.
If a digital value of the RSI is greater or equal to UpLevel = 70 (or whatever number you decided to put) then a Red square will appear. This is potentially an overbought condition and maybe a good time to go Short.
If a digital value of the RSI is between an UpLevel and a DnLevel then a Gray square will appear.
Input parameters:
From Symb1 to Symb9 - you may change any of this Symbol to any legal currency pair existed on your platform.
rPeriod = 14; - averaging period for the RSI.
appPrice = PRICE_CLOSE; - apply price for the RSI.
UpLevel = 70; - overbought level.
DnLevel = 30; - oversold level.
SymbColor = clrWhite; - you may change the color of all labels.
Attention:
Before using this indicator you have to open all charts (all TF) for all 9 currency pairs.


 网络资源
网络资源