Trend check
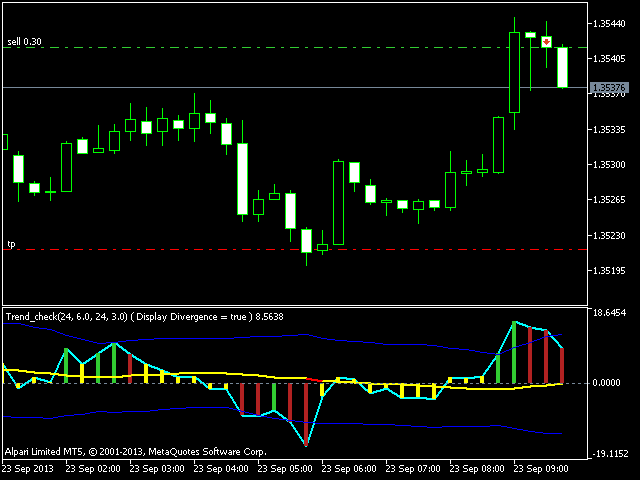
This indicator gives full information about the market state: strength and direction of a trend, volatility and price movement channel. It has two graphical components:Histogram: the size and the color of a bar show the strength and direction of
This indicator gives full information about the market state: strength and direction of a trend, volatility and price movement channel. It has two graphical components:
Histogram: the size and the color of a bar show the strength and direction of a trend. Positive values show an ascending trend and negative values - a descending trend. Green bar is for up motion, red one - for down motion, and the yellow one means no trend. Signal line is the value of the histogram (you can enable divergence search).
Trend channel: upper border, lower border and the center of the channel (middle line). Color of the middle line shows the slope of the channel, and the channel width shows the volatility.
Trading
Buy: signal line have crossed the lower border of the channel, the histogram shows the beginning of upward motion. The line is either yellow (channel is horizontal) or green (the channel is directed upwards). It is recommended to move the position to breakeven when reaching the middle of the channel. Close positions when conditions for selling are formed.
Sell: signal line have crossed the upper border of the channel, the histogram shows the beginning of downward motion. The line is either yellow (channel is horizontal) or red (the channel is directed downwards). It is recommended to move the position to breakeven when reaching the middle of the channel. Close positions when conditions for buying are formed.
You can also use divergence for entering deals. If a divergence signal is received after the signal line crossed the channel border, you can enter in the direction of the opposite border of the channel without waiting for confirmation from the histogram. It is not recommended to enter a trade at low volatility of the market (when the channel is narrow). It is not recommended to sell when the channel is directed upwards (the middle line is green). It is not recommended to buy when the channel is directed downwards (the middle line is red).
The histogram represents a graph of changes of the regression line slope. The channel is the standard deviation from the average slope of the regression line.
Input Parameters:
Period histogram - period for calculation of the histogram, 24 on default;
Treshold histogram - threshold value for displaying the histogram when there is no trend, 6.0 on default (range: from -6.0 to 6.0);
Period volatility band - period for calculation of the volatility channel, 24 on default;
Treshold volatility band - threshold value for displaying the horizontal orientation of the trend channel, 3.0 on default (range: from -3.0 to 3.0);
Display cross bands volatility alert - notification when the signal line crosses the channel borders, true on default;
Display divergence arrow - displaying divergence graphically (arrows), false on default;
Display divergence alert - notification about divergence, false on default.
Currency pair - any. Timeframe - any.


 网络资源
网络资源