Angle Regression Line with Divergence
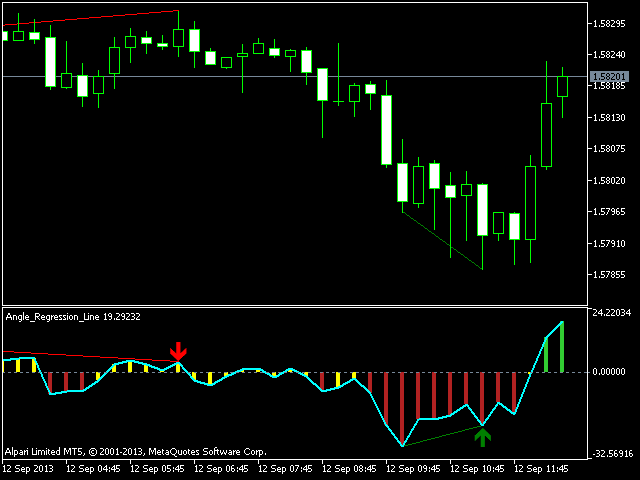
The indicator allows determining the strength and direction of the trend precisely. The histogram displayed in a separate window shows changes of the slope of the regression line. A signal for entering a deal is crossing the zero line and/or a diverg
The indicator allows determining the strength and direction of the trend precisely. The histogram displayed in a separate window shows changes of the slope of the regression line. A signal for entering a deal is crossing the zero line and/or a divergence. The indicator is also useful for wave analysis.
Input Parameters:
Period - period of calculation, 24 on default;
CalculatedBar - number of bars for displaying a divergence, 300 on default;
AngleTreshold - slope at which a flat is displayed, 6.0 on default (within the range from -6.0 to 6.0);
DisplayDiverAlert - enables notifications about divergence, true on default;
DisplayCrossZeroAlert - enables notifications about crossing the zero line, true on default;
DrawIndicatorTrendLines - enables displaying the trend lines of the indicator during divergence, true on default;
DrawPriceTrendLines - enables displaying the trend lines on the price chart during divergence, true on default;
LineBullDiverColor - select a color for the trend lines displayed during bullish divergence, Green on default;
LineBearDiverColor - select a color for the trend lines displayed during bearish divergence, Red on default.
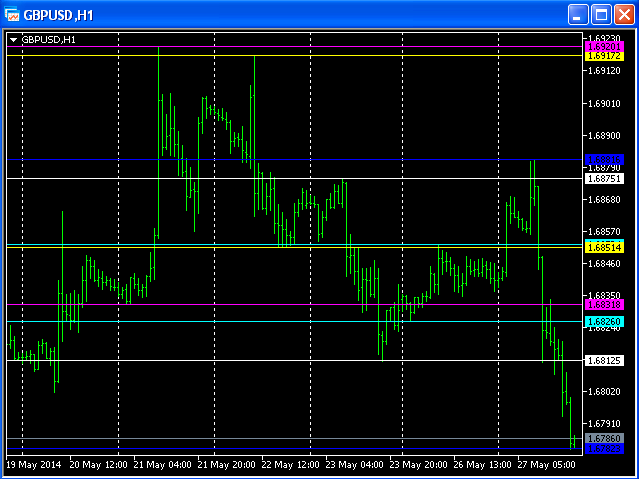
Currency pair - any. Timeframe - any. Screenshots: GBPUSD М15, a real deal on EURUSD M15.


 网络资源
网络资源